Features
Integrations
Resources
Templates
Pricing
Login
Signup
Home
Resources
Blog
DocsAutomator's Blog
Tutorials, user stories and best practices for automating documents.
All Articles
Case Studies
Tutorials
News
June 4, 2026
|
News
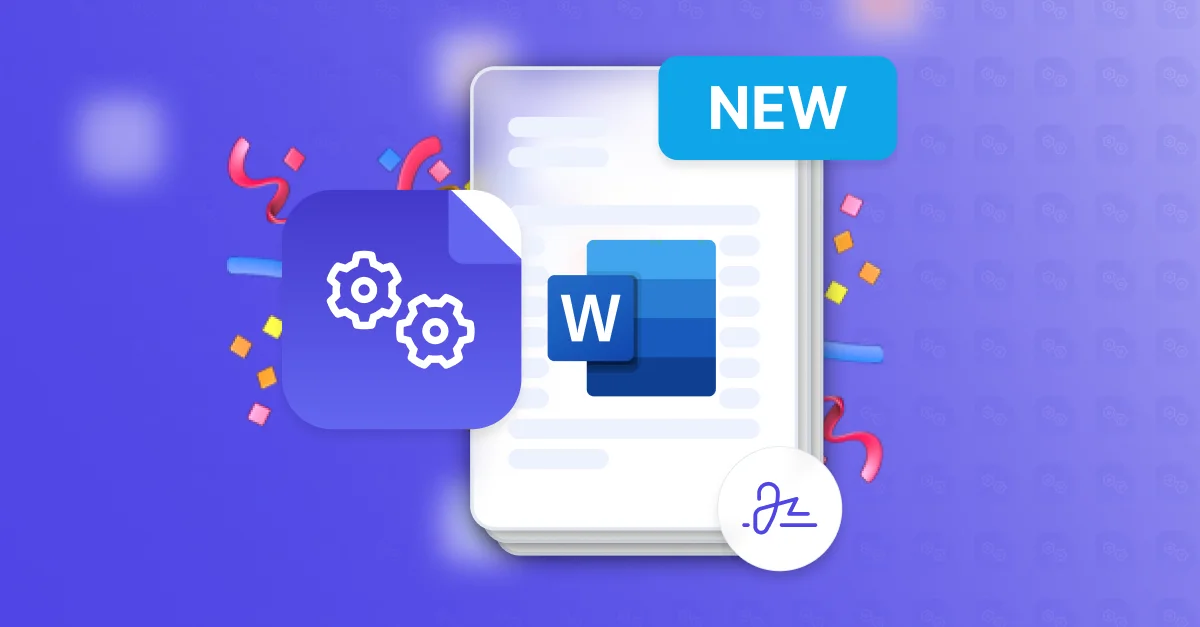
Introducing Microsoft Word (.docx) Templates in DocsAutomator
DocsAutomator now supports native Microsoft Word (.docx) templates: same placeholder syntax, line items, conditional logic, and e-signing built in.
Read full article
May 27, 2026
|
News
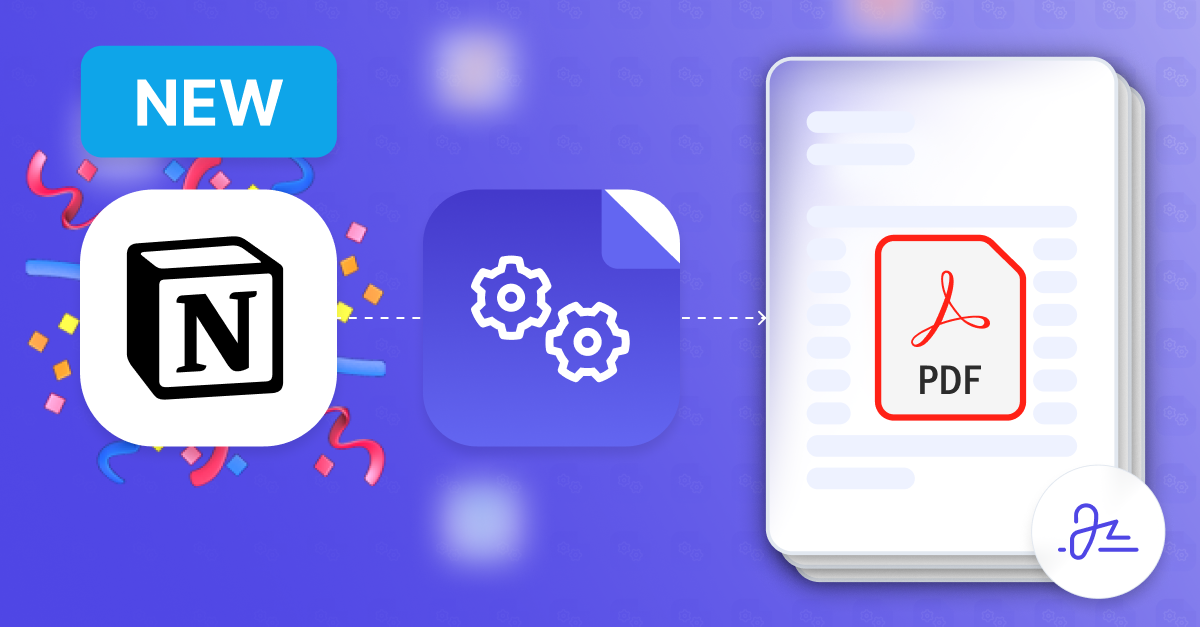
Introducing the Notion Integration: Generate Documents From Your Notion Databases
DocsAutomator now supports Notion as a native data source. Turn Notion database records into polished PDFs and Google Docs with e-signatures, email delivery, and flexible automation triggers. No code required.
Read full article
May 13, 2026
|
Tutorials
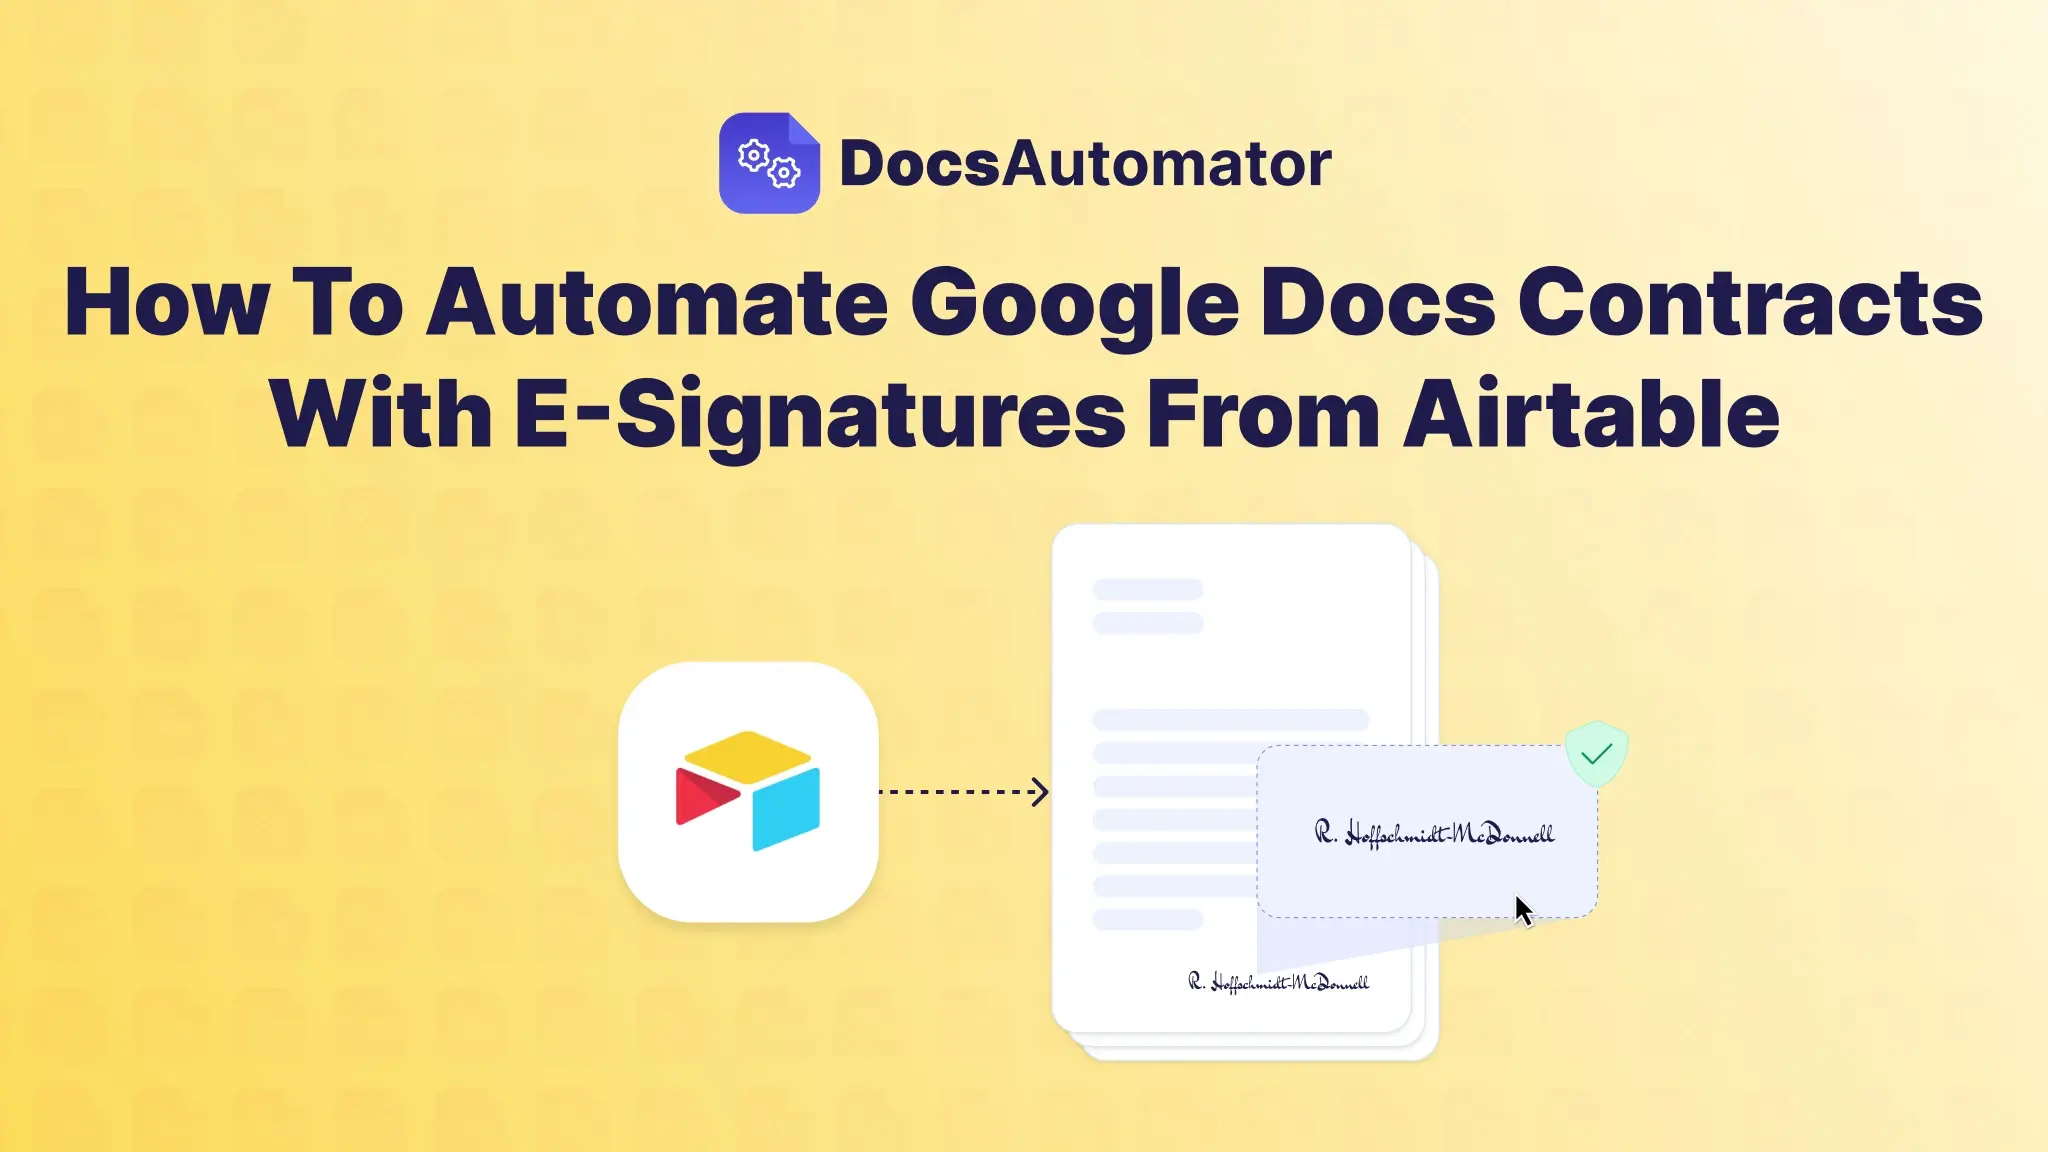
How To Automate Google Docs Contracts With E-Signatures From Airtable
Step-by-step: turn a Google Docs contract template into an Airtable workflow with e-signatures. Setup for sales, employment, and compliance contracts.
Read full article
May 6, 2026
|
Case Studies
How Quivvy Solutions Automates Documents for 12+ Clients Across 3 Languages
How Quivvy Solutions, a Belgian Airtable Gold Partner, automates documents for 12+ clients in 3 languages with DocsAutomator — including dynamic contracts for Brand Activators.
Read full article
May 4, 2026
|
Tutorials
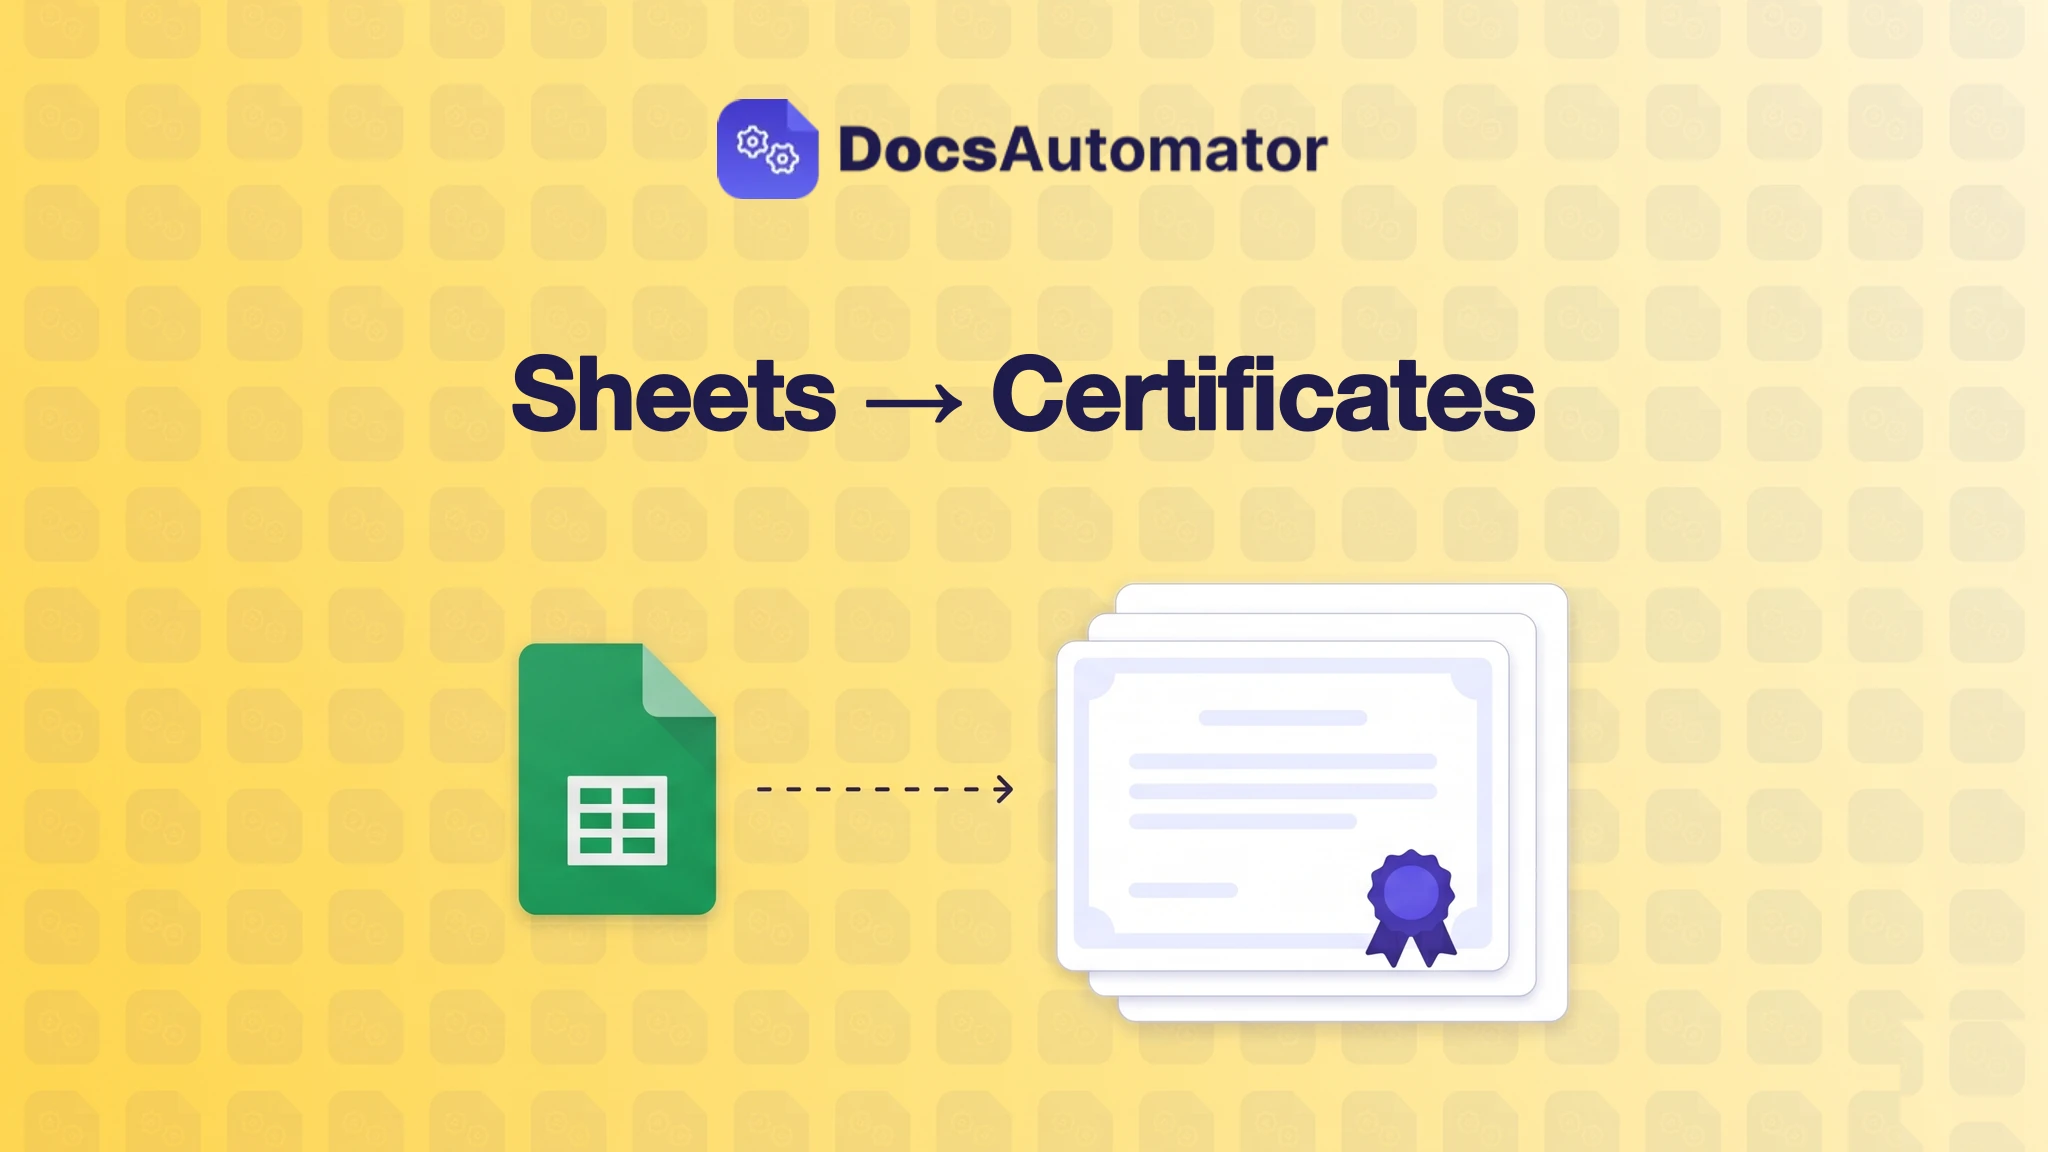
How to Generate Certificates of Completion from Google Sheets at Scale
Generate certificates from a Google Sheet at scale. A step-by-step guide using any Google Docs certificate template + DocsAutomator to issue PDFs in batch.
Read full article
March 10, 2026
|
Case Studies
How V88 Delivers Reliable PDF Generation Across Complex Client Solutions
Learn how V88, a UK-based AI and no-code consultancy, uses DocsAutomator to power PDF generation across complex client solutions, from local authority legal documents to certificates and invoices.
Read full article
February 25, 2026
|
Case Studies
How Workflow Heroes Automates Documents for 100+ Clients with DocsAutomator
Learn how Workflow Heroes, a Dutch Airtable agency, uses DocsAutomator to automate quotations, invoices, and complex documents for 100+ clients, replacing multiple tools with one platform and scaling their ERP business.
Read full article
January 14, 2026
|
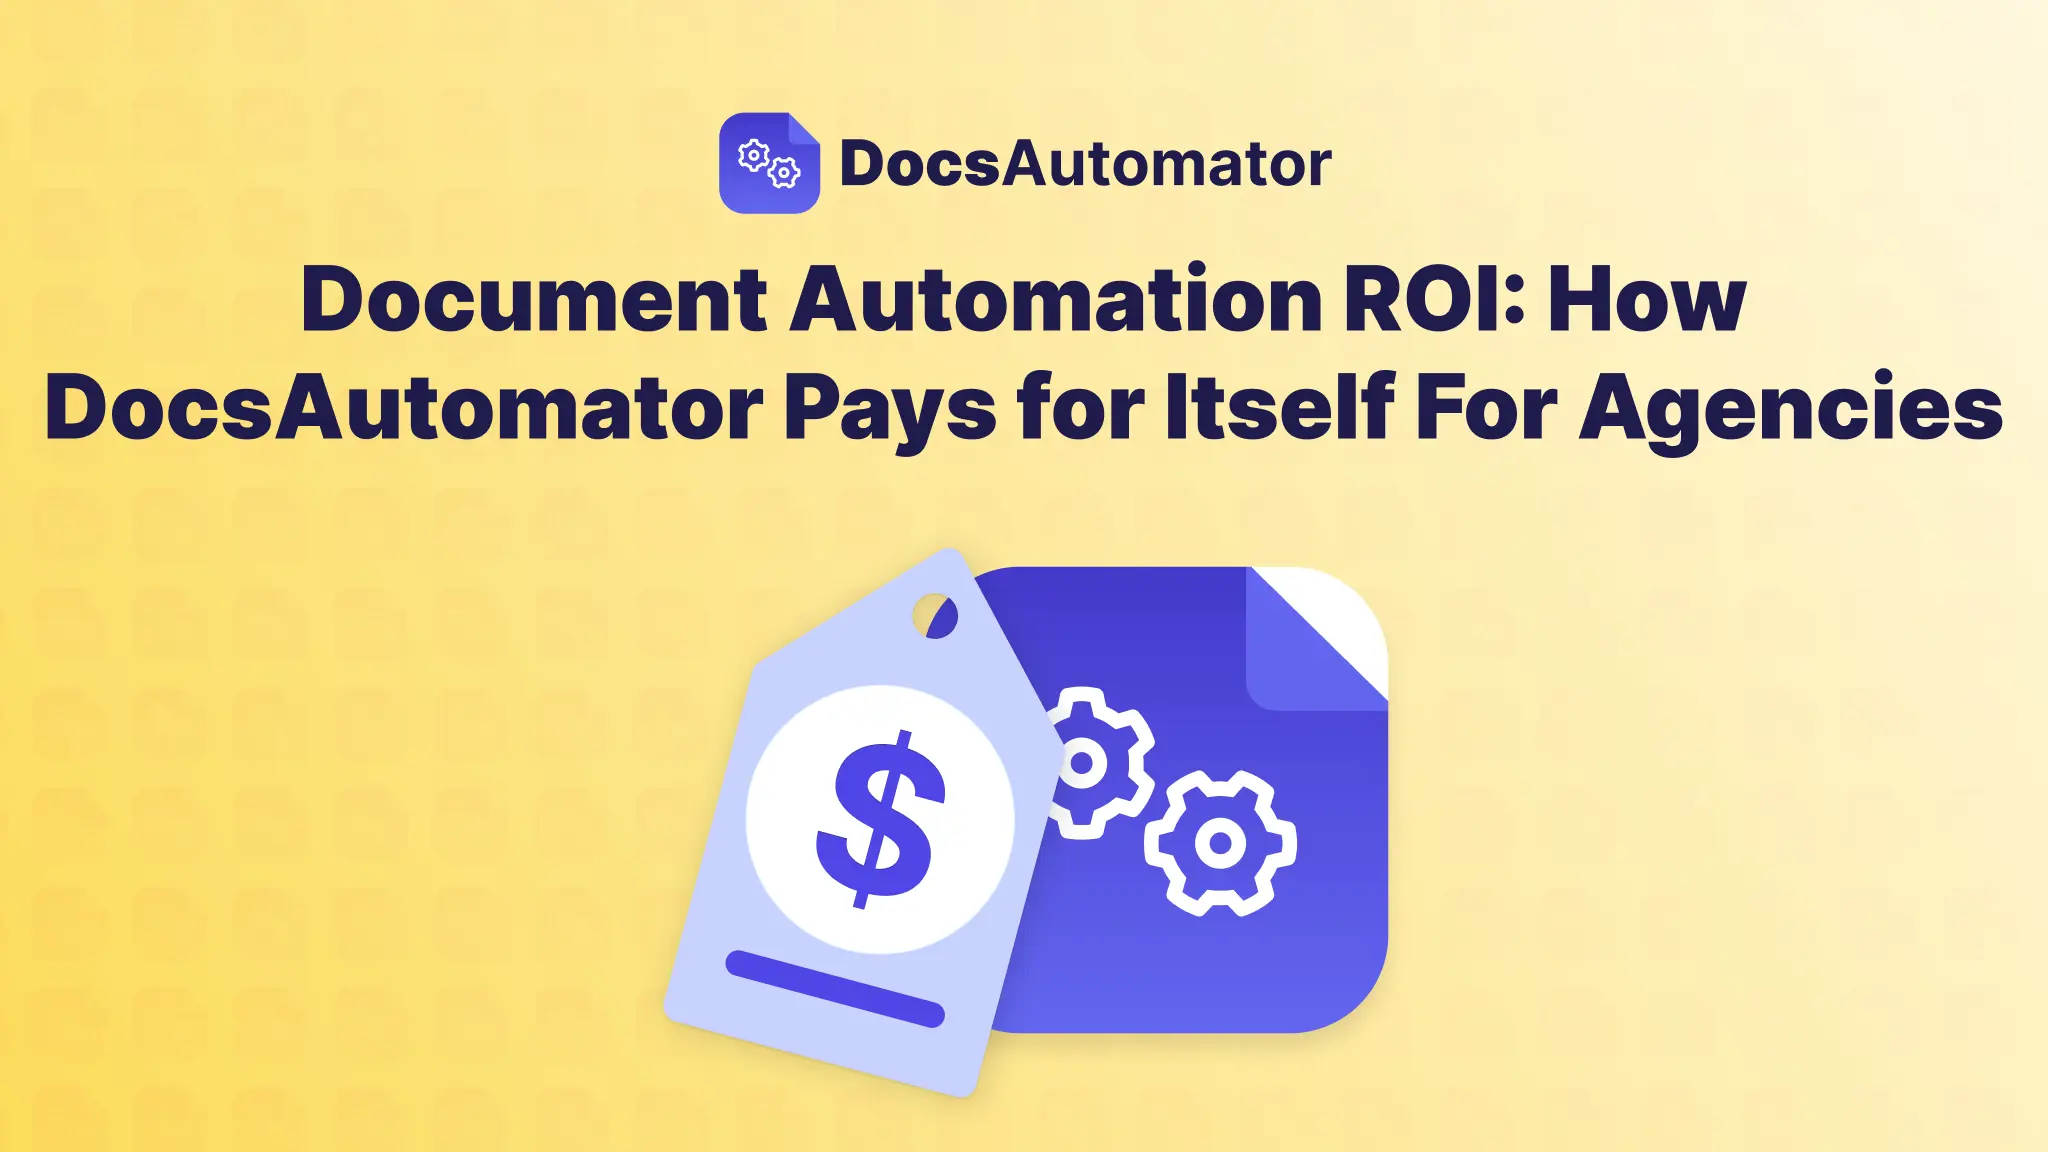
Tutorials
Document Automation ROI: How DocsAutomator Pays for Itself For Agencies
See the real ROI of document automation for agencies with calculate time saved, revenue recovered, and why DocsAutomator pays for itself in days.
Read full article
January 13, 2026
|
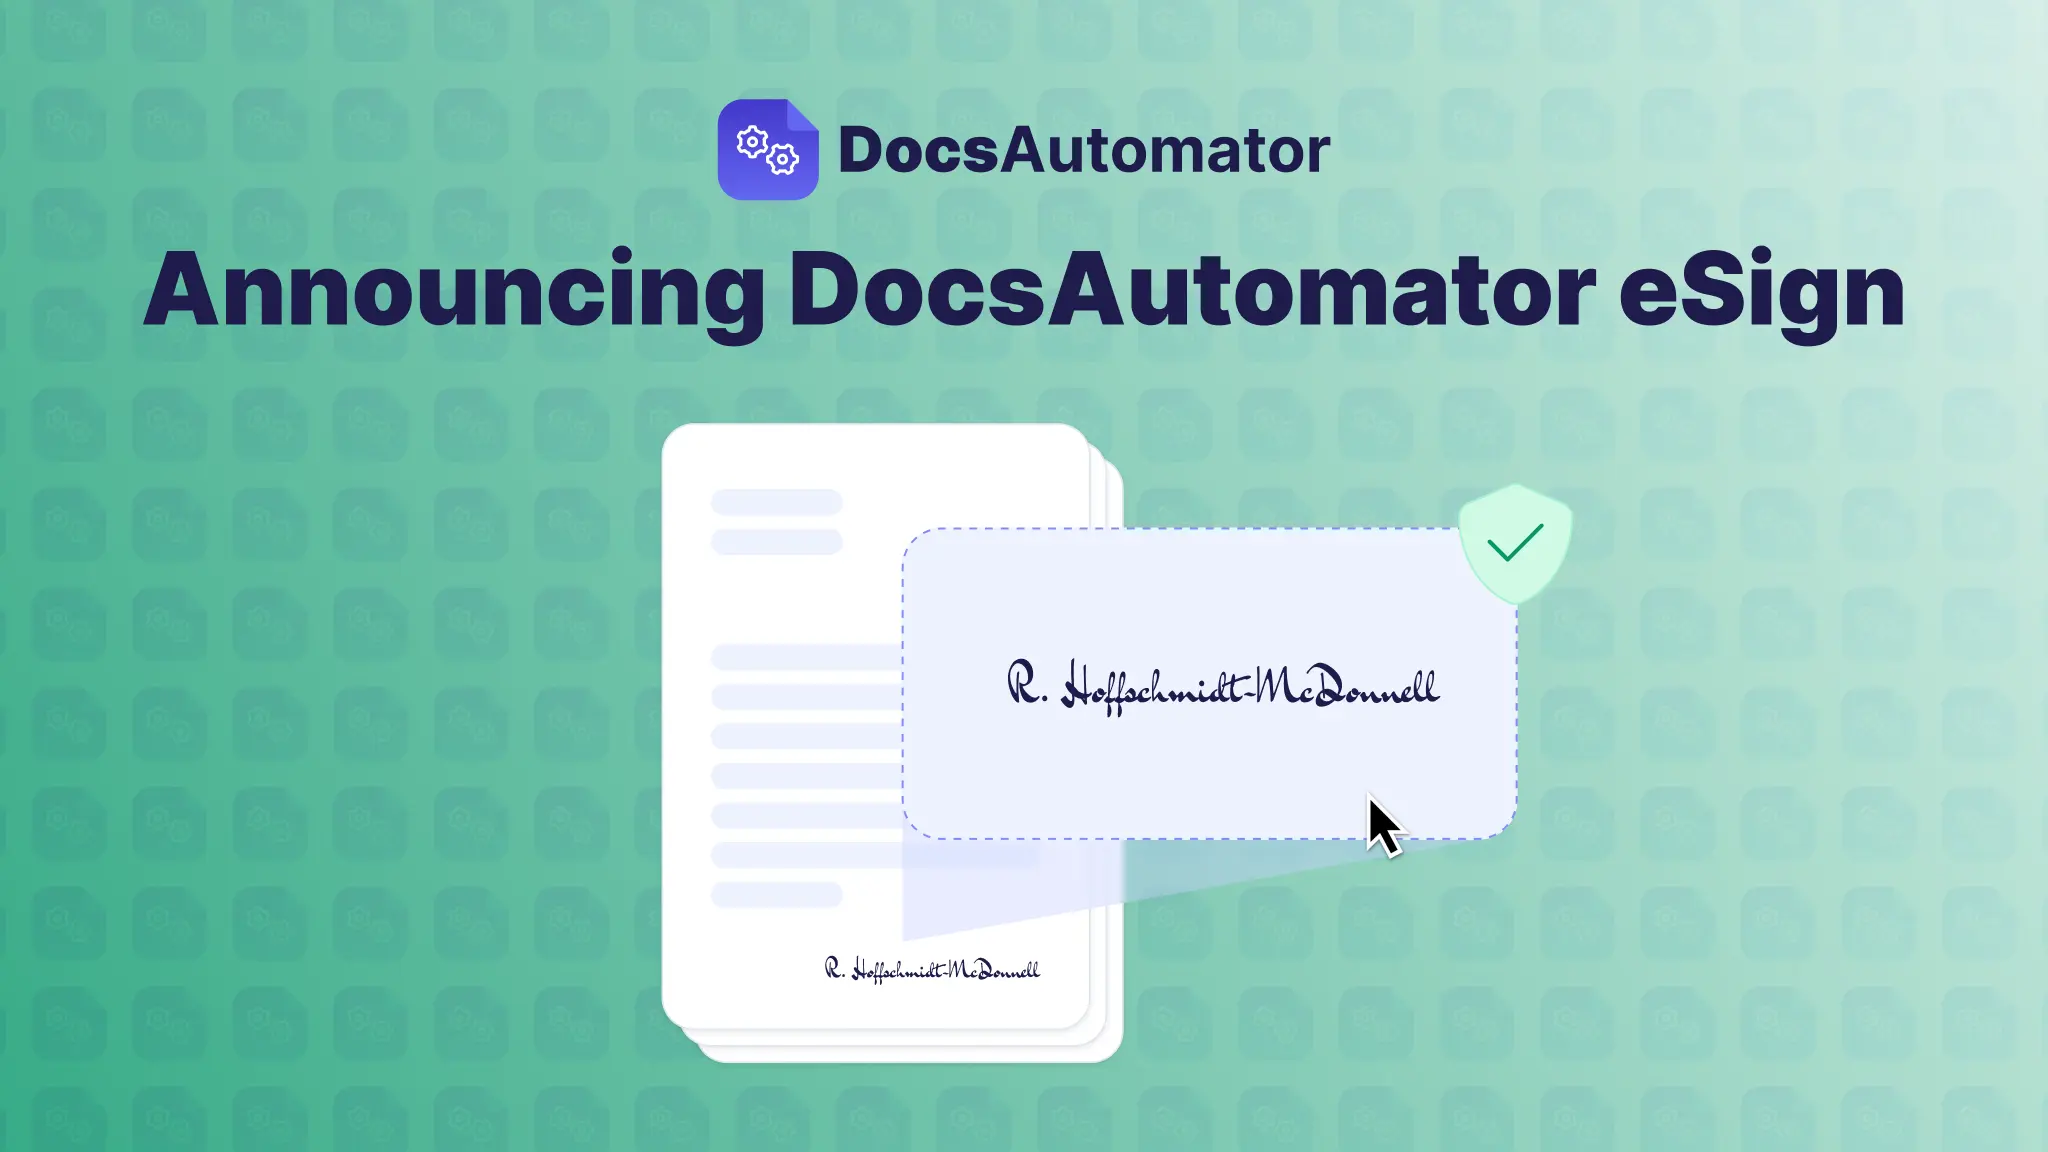
News
Announcing DocsAutomator eSign: Collect Legally Binding Signatures on Your Automated Documents
We're excited to introduce DocsAutomator eSign, a powerful new add-on that brings electronic signatures directly into your document automation workflow.
Read full article
January 13, 2026
|
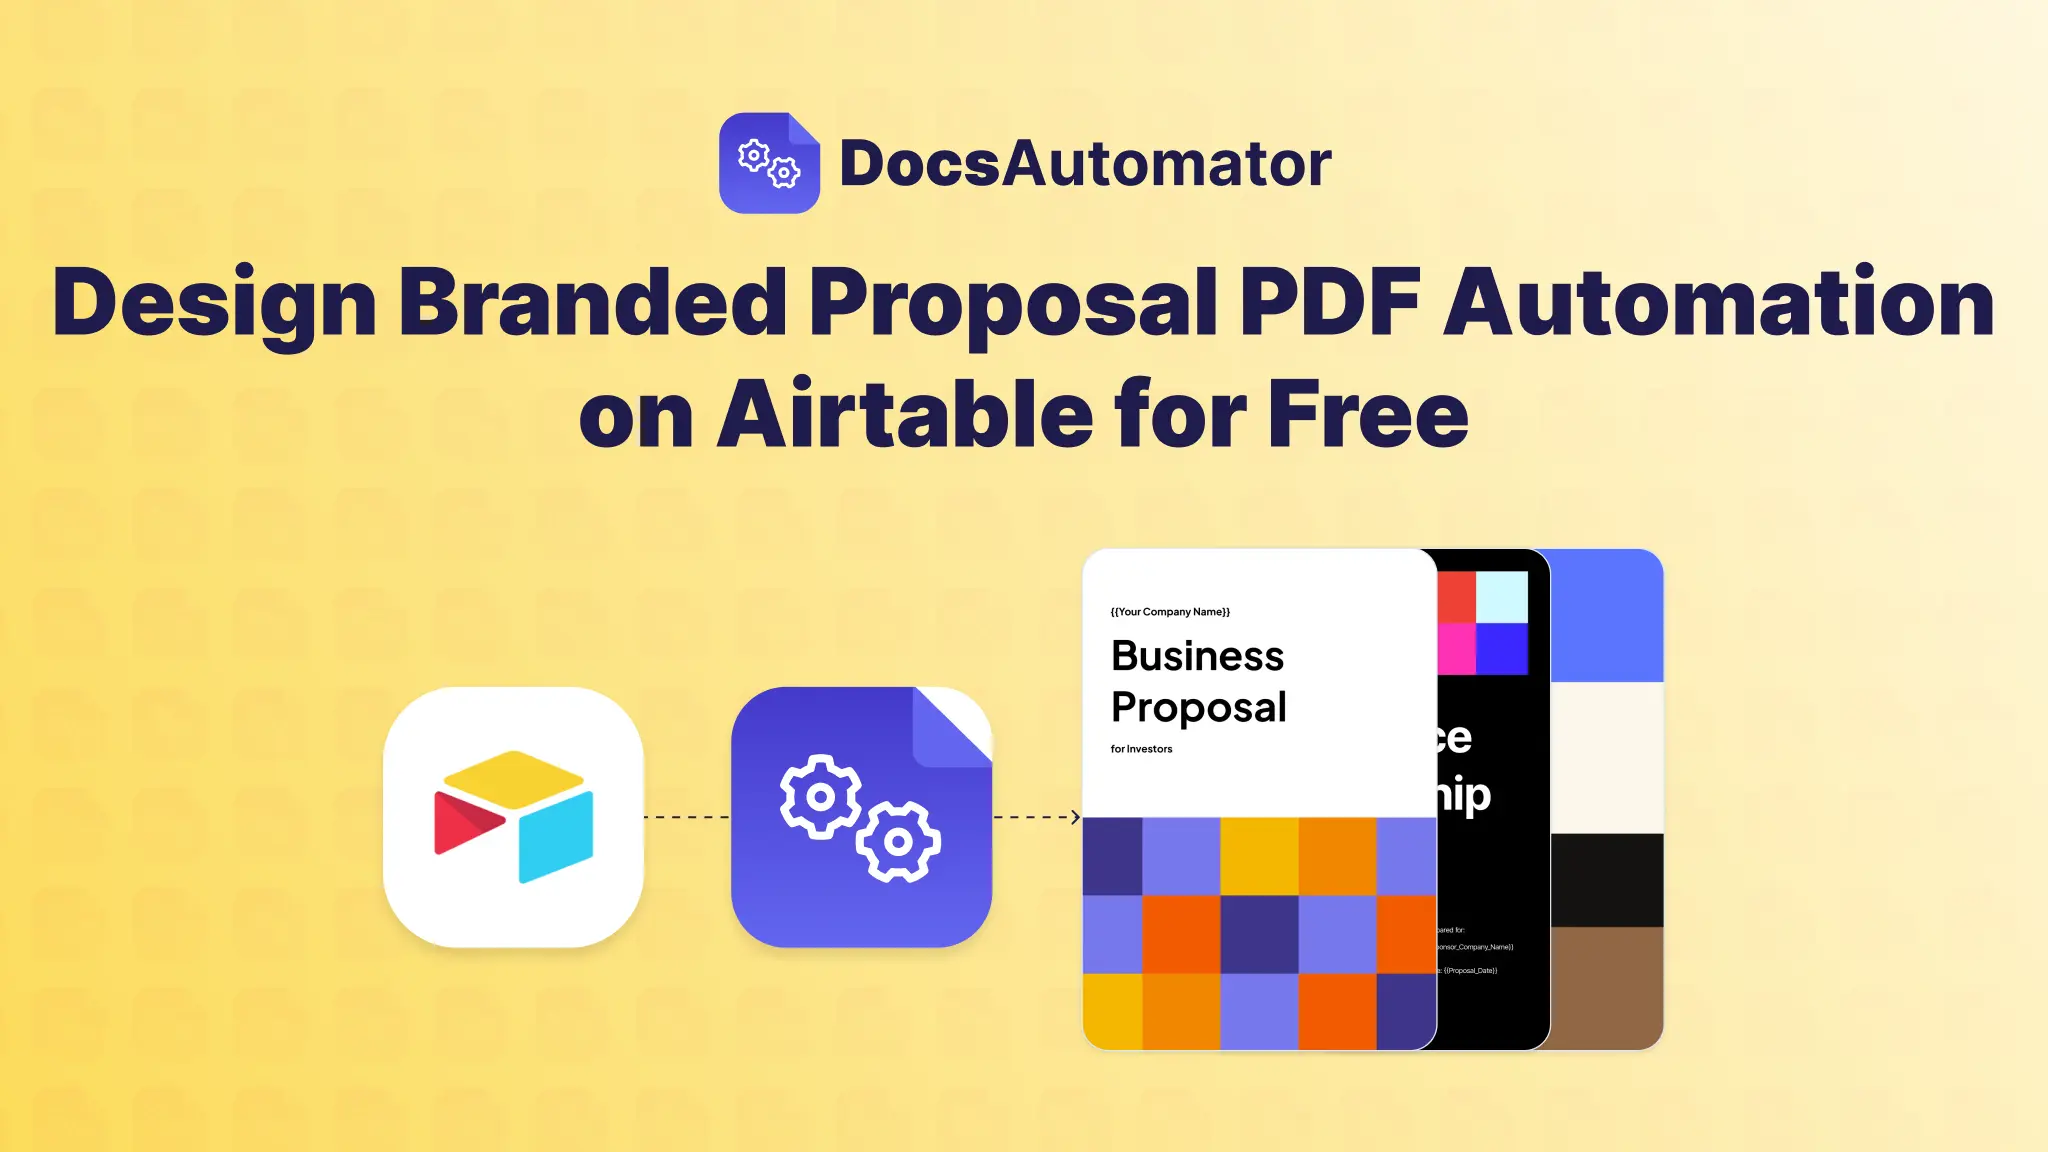
Tutorials
Design Branded Proposal PDF Automation on Airtable for Free
Learn how to design and automate branded proposal PDFs from Airtable using Google Docs and DocsAutomator with no Page Designer limits, no manual work.
Read full article
January 12, 2026
|
Tutorials
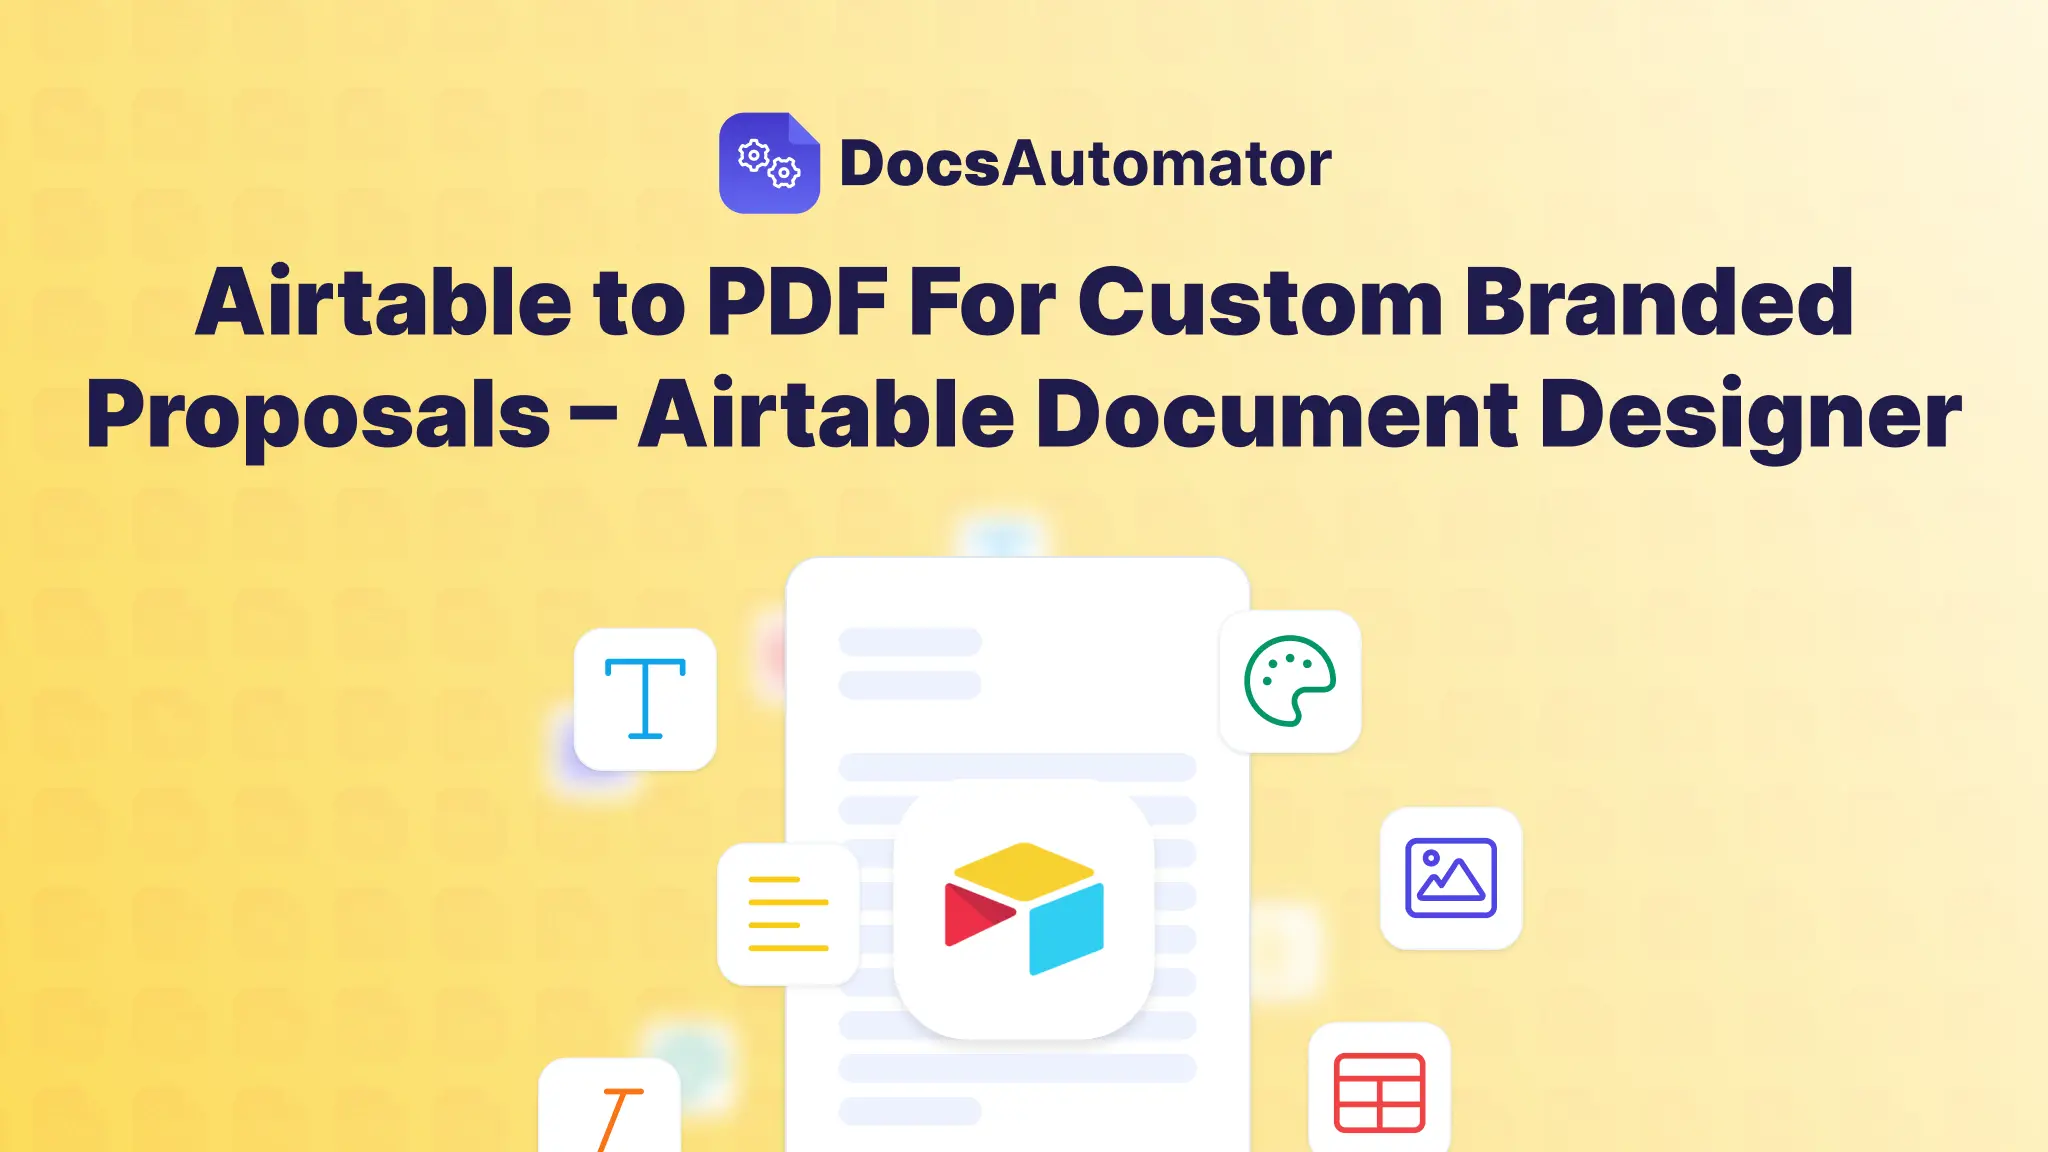
Airtable to PDF For Custom Branded Proposals – Airtable Document Designer
Design custom branded proposals by automating Airtable to PDF using Google Docs and DocsAutomator’s document automation designer for free.
Read full article
January 9, 2026
|
Tutorials
10 Proposal Mistakes Agencies Can Eliminate Using Document Automation
Discover 10 proposal mistakes agencies make due to manual workflows and learn how document automation with DocsAutomator improves accuracy, speed, and win rates.
Read full article
January 9, 2026
|
Tutorials
Free Airtable to Google Docs Automation For Custom Client Reporting
Learn how to automate Airtable to Google Docs client reporting for free using DocsAutomator and eliminate manual copy-paste, formatting, and delivery work.
Read full article
December 23, 2025
|
Tutorials
Step-by-Step: Client Report Document Automation With Airtable and DocsAutomator
Learn how to set up Airtable-to-PDF client report automation step by step using DocsAutomator—no code required, just faster and error-free reporting.
Read full article
December 4, 2025
|
Tutorials
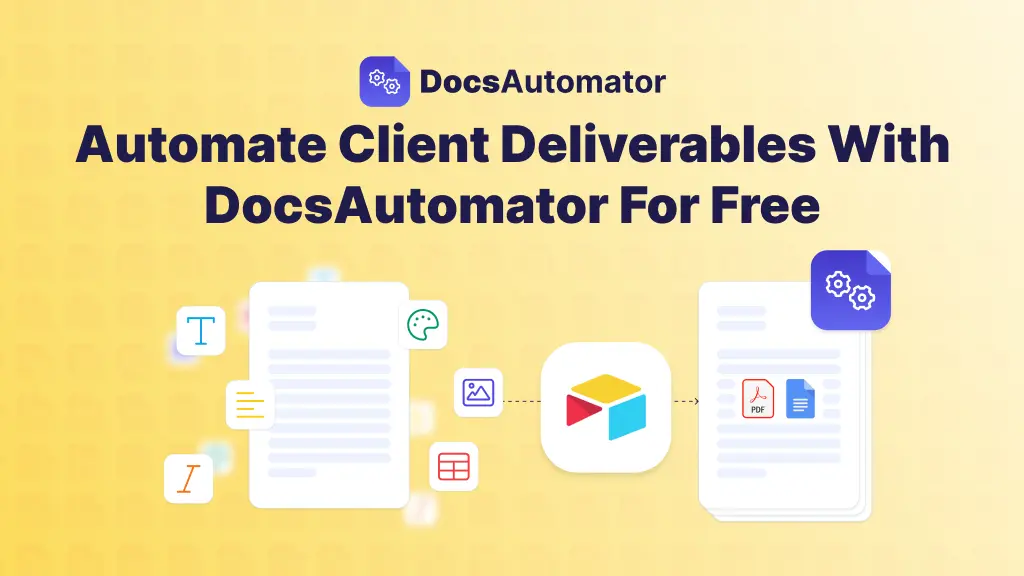
Airtable to PDF: Automate Client Deliverables With DocsAutomator For Free
Learn how to automate Airtable to PDF client reports across performance, audits, proposals, and budgets using DocsAutomator’s free no-code document automation.
Read full article
December 3, 2025
|
Tutorials
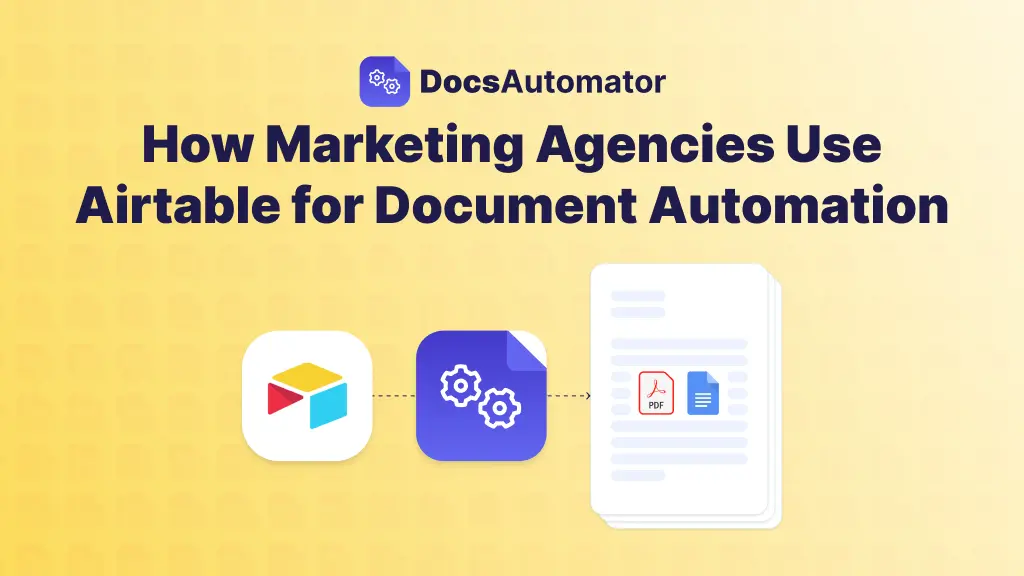
How Marketing Agencies Use Airtable for Document Automation
Use 5 marketing agency document automation workflows for Airtable to Google Docs using DocsAutomator to automate invoices, proposals, reports, and SLAs.
Read full article
October 22, 2025
|
News
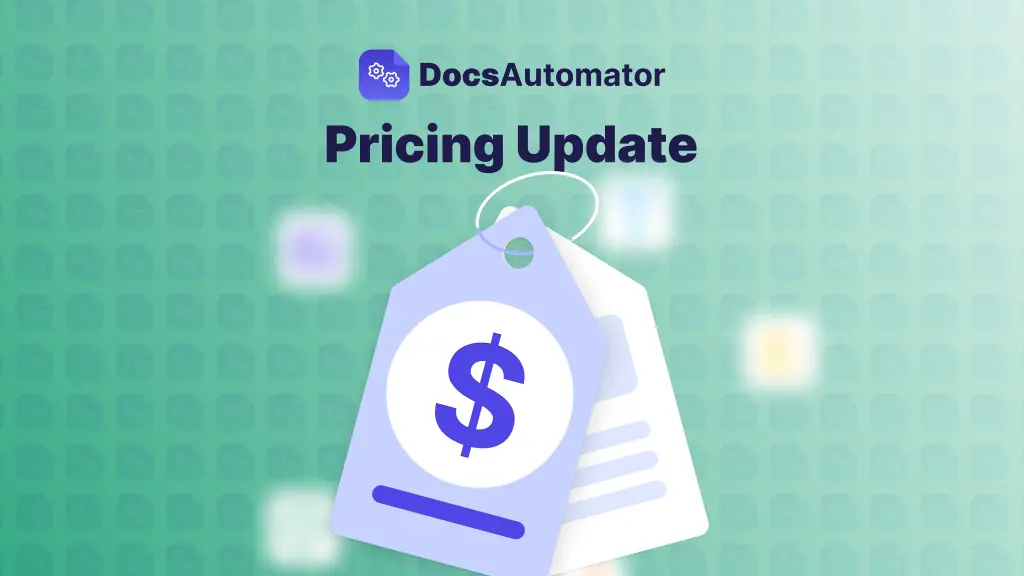
DocsAutomator Pricing Update
We're updating our pricing structure starting November 15th, 2025. Here's everything you need to know about what's changing and what it means for you.
Read full article
July 9, 2025
|
Tutorials
Automate Contract Creation and Streamline Your Workflow
Learn to automate contract creation with practical steps. This guide covers templates, data sources, and tools to save time and reduce errors.
Read full article
July 8, 2025
|
Tutorials
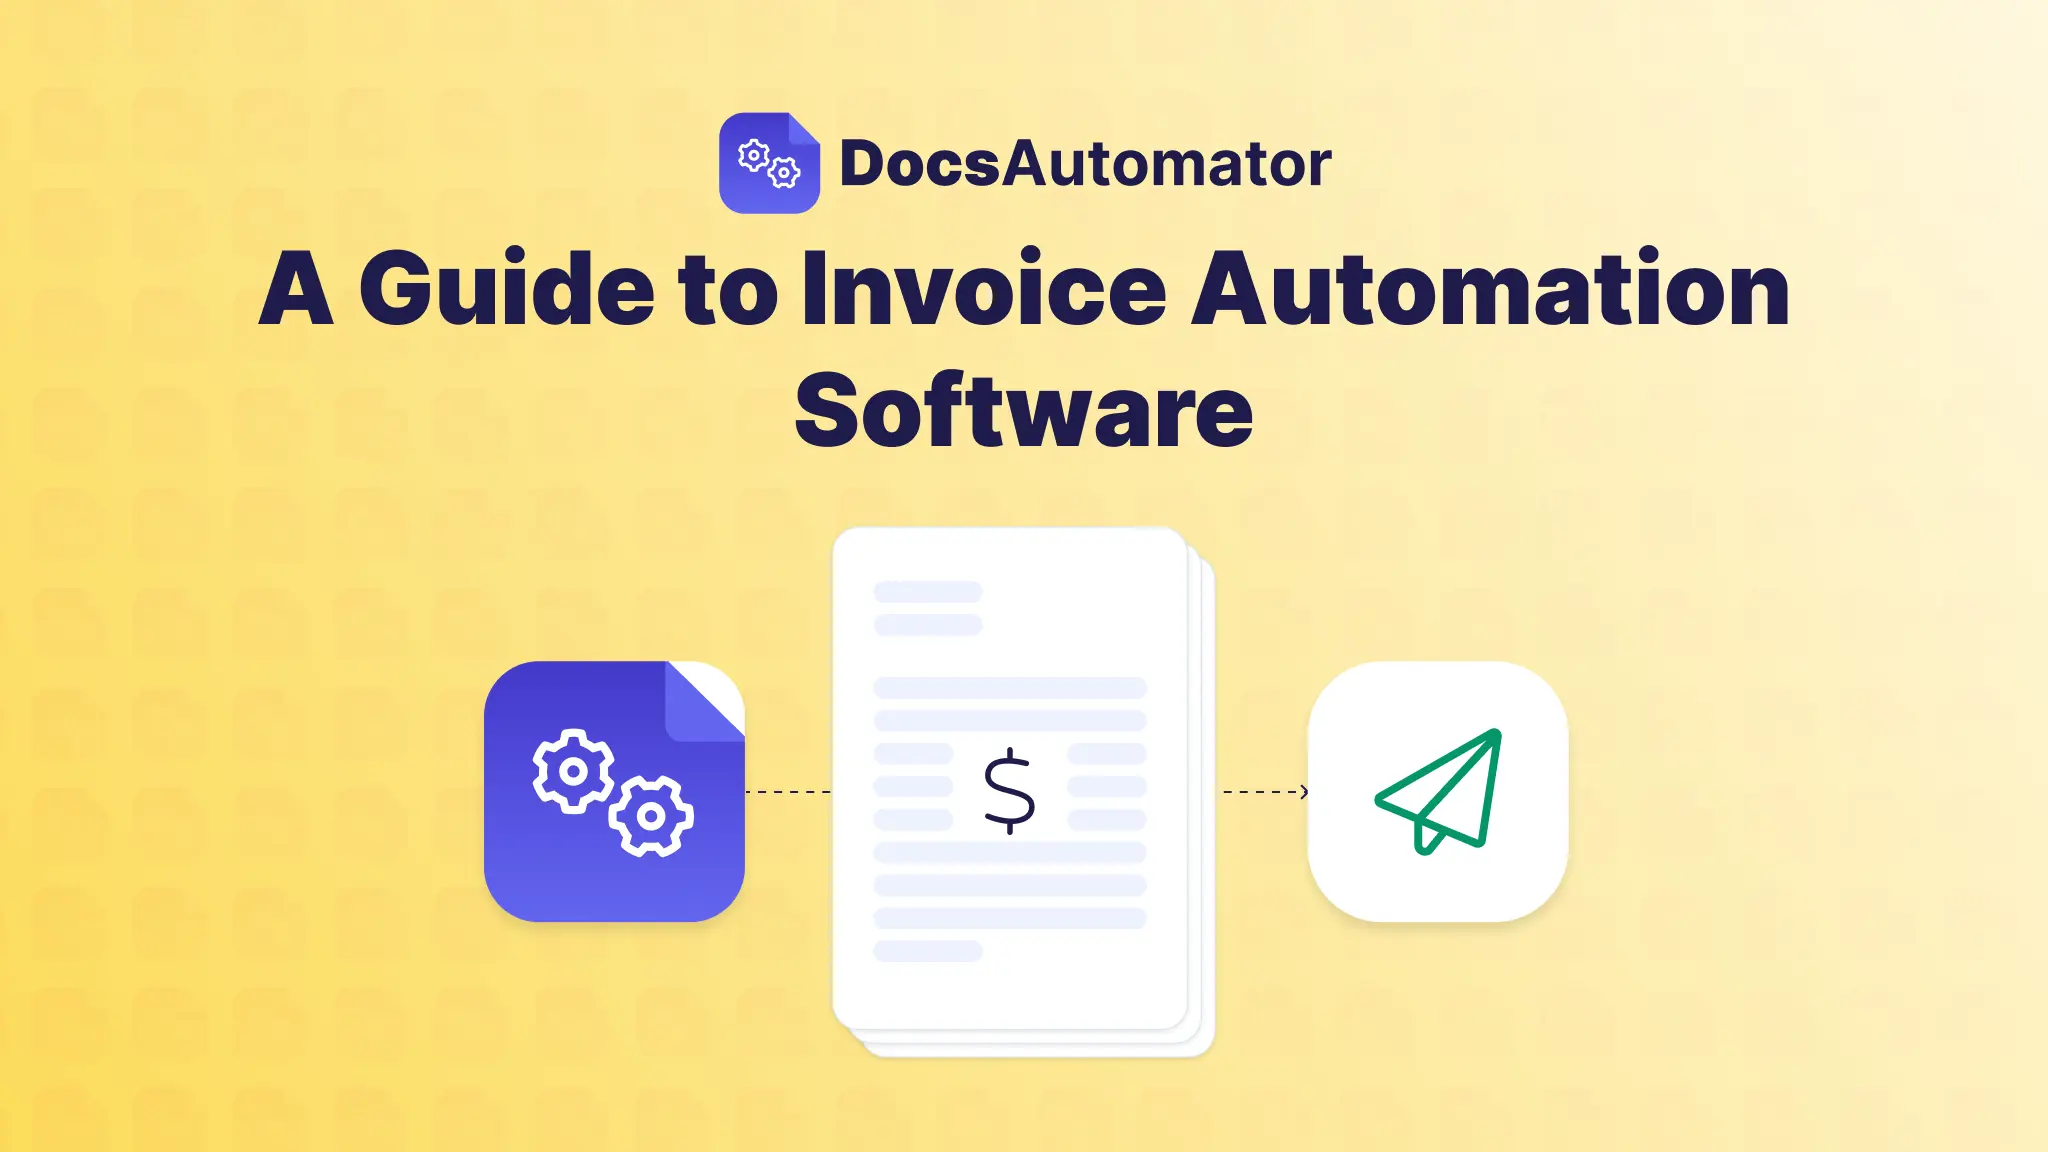
A Guide to Invoice Automation Software
Discover how invoice automation software transforms your financial workflow, saves time, and boosts accuracy. Learn to choose and implement the right solution.
Read full article
July 7, 2025
|
Tutorials
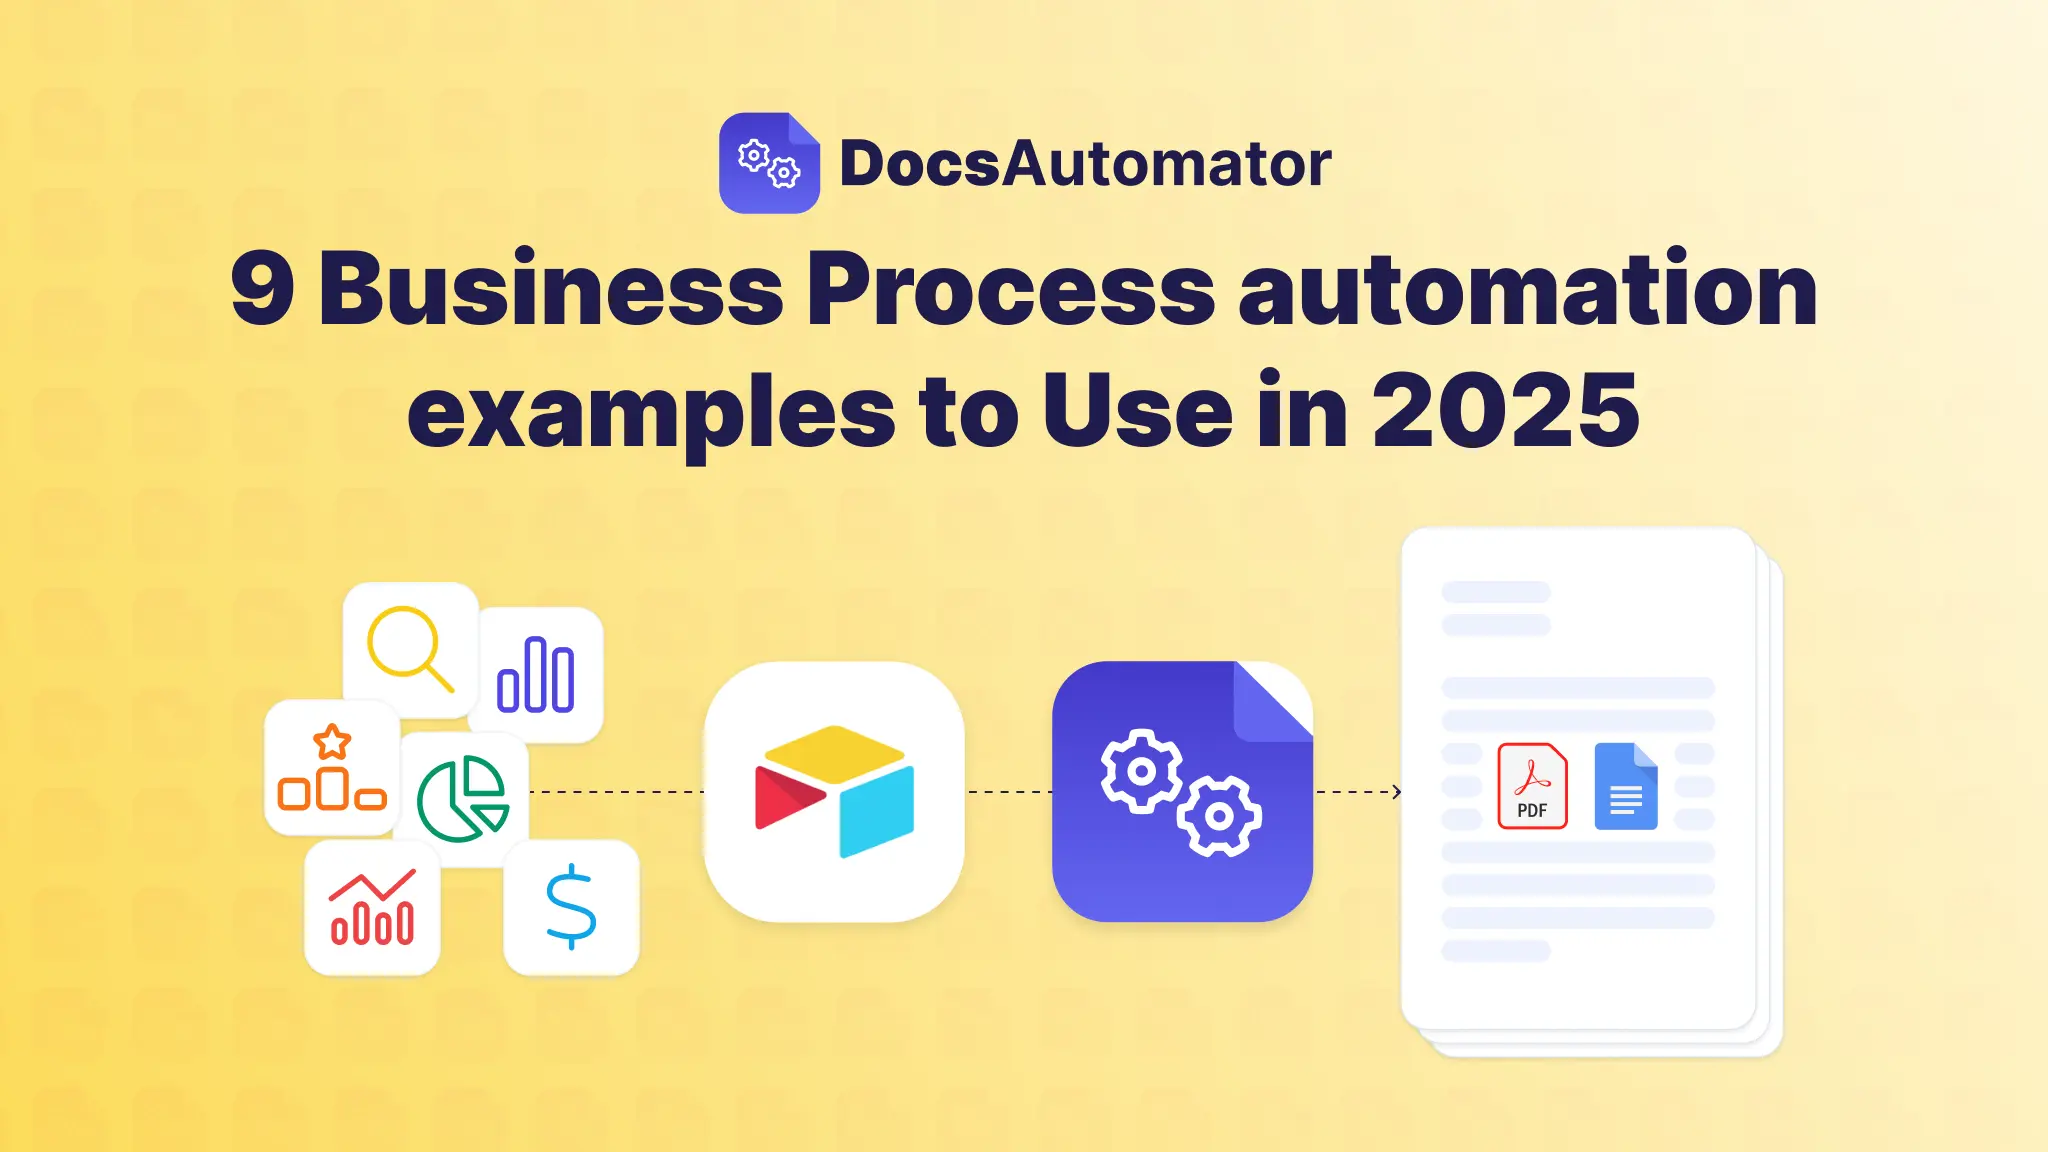
9 Business Process Automation Examples to use in 2025
Explore 9 powerful business process automation examples. Learn how to streamline finance, HR, and marketing workflows with actionable, replicable strategies.
Read full article
July 6, 2025
|
Tutorials
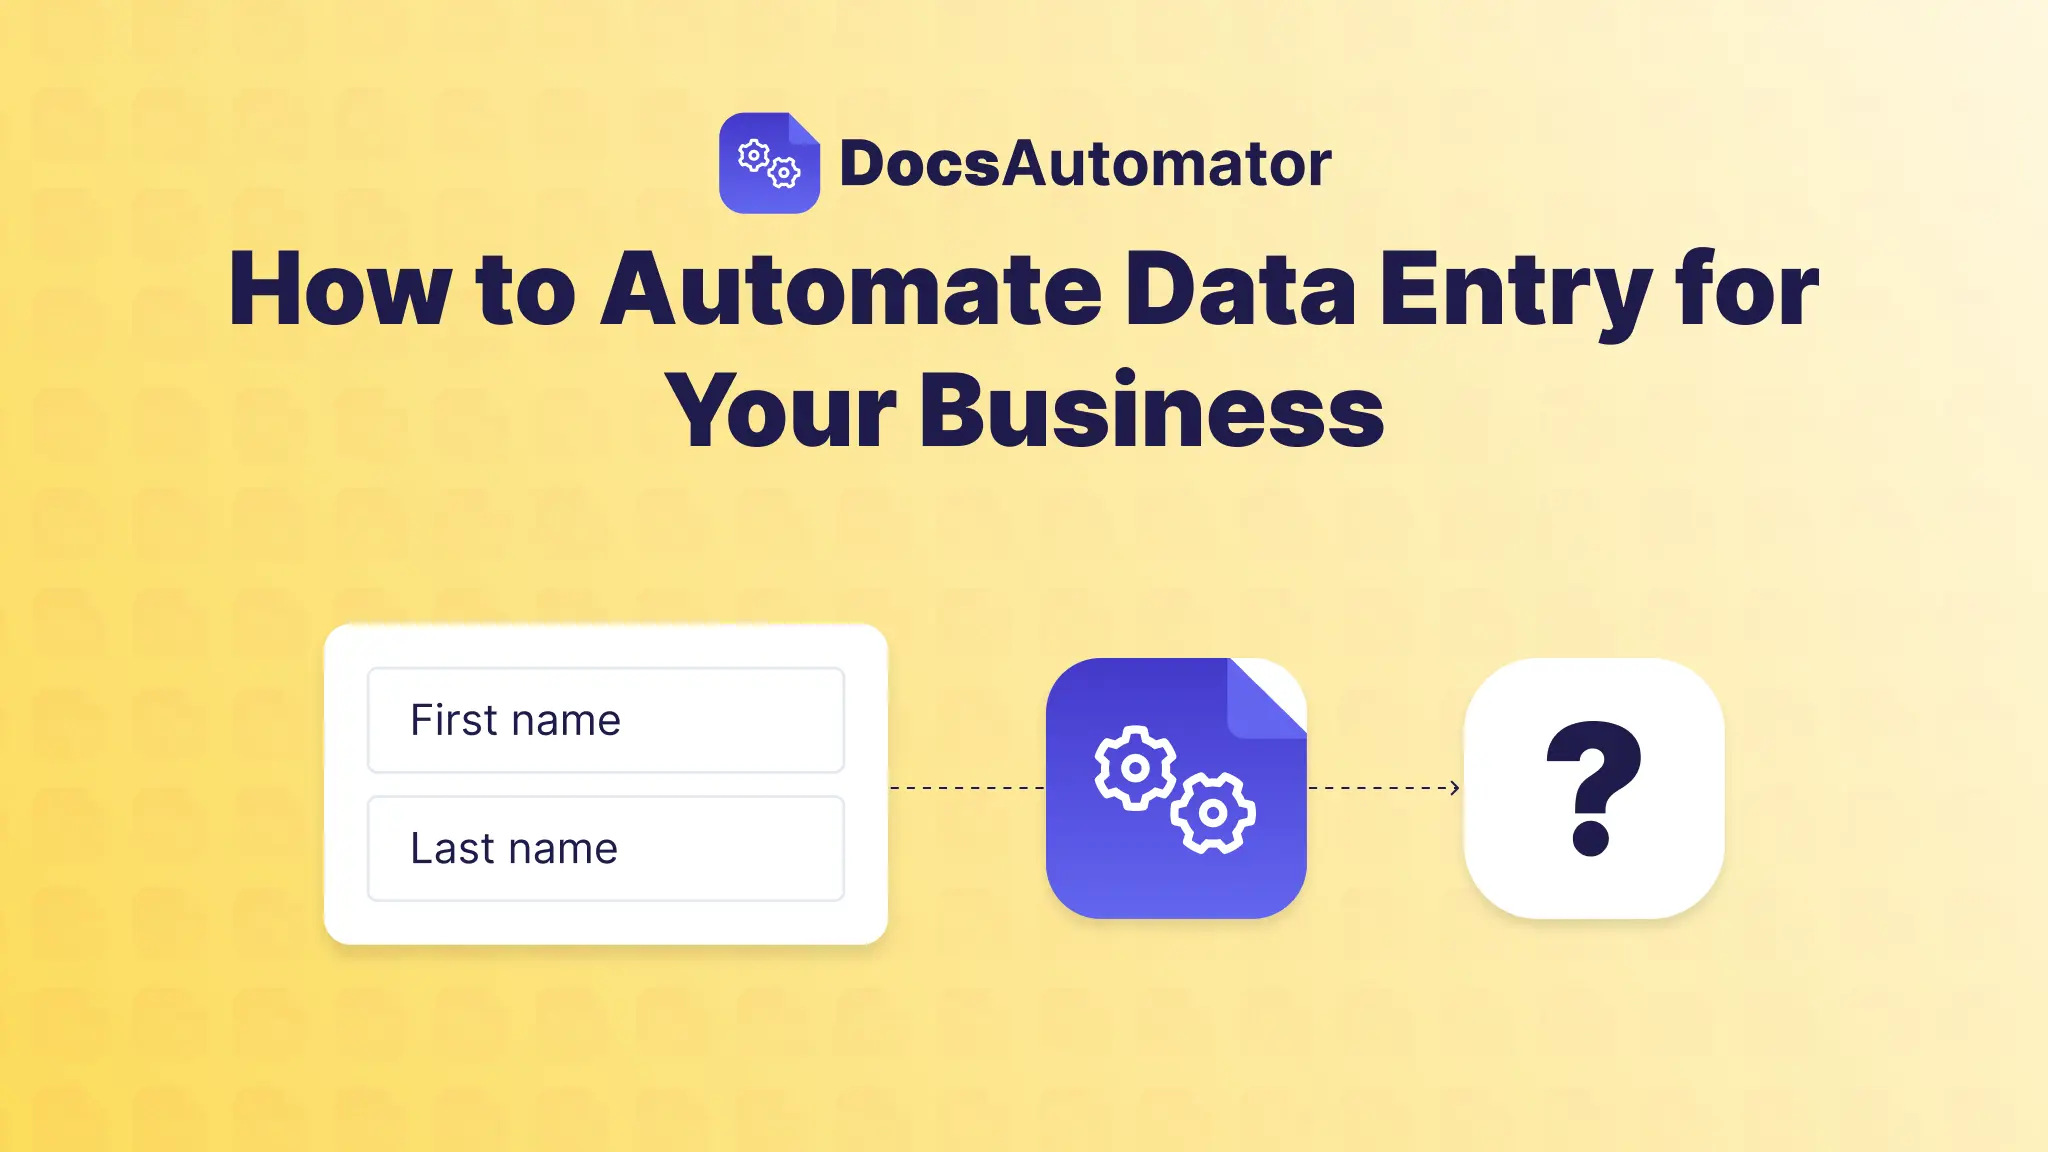
How to Automate Data Entry for Your Business
Learn how to automate data entry with no-code tools. This guide shows you how to reduce errors, save time, and scale your business with practical examples.
Read full article
July 5, 2025
|
Tutorials
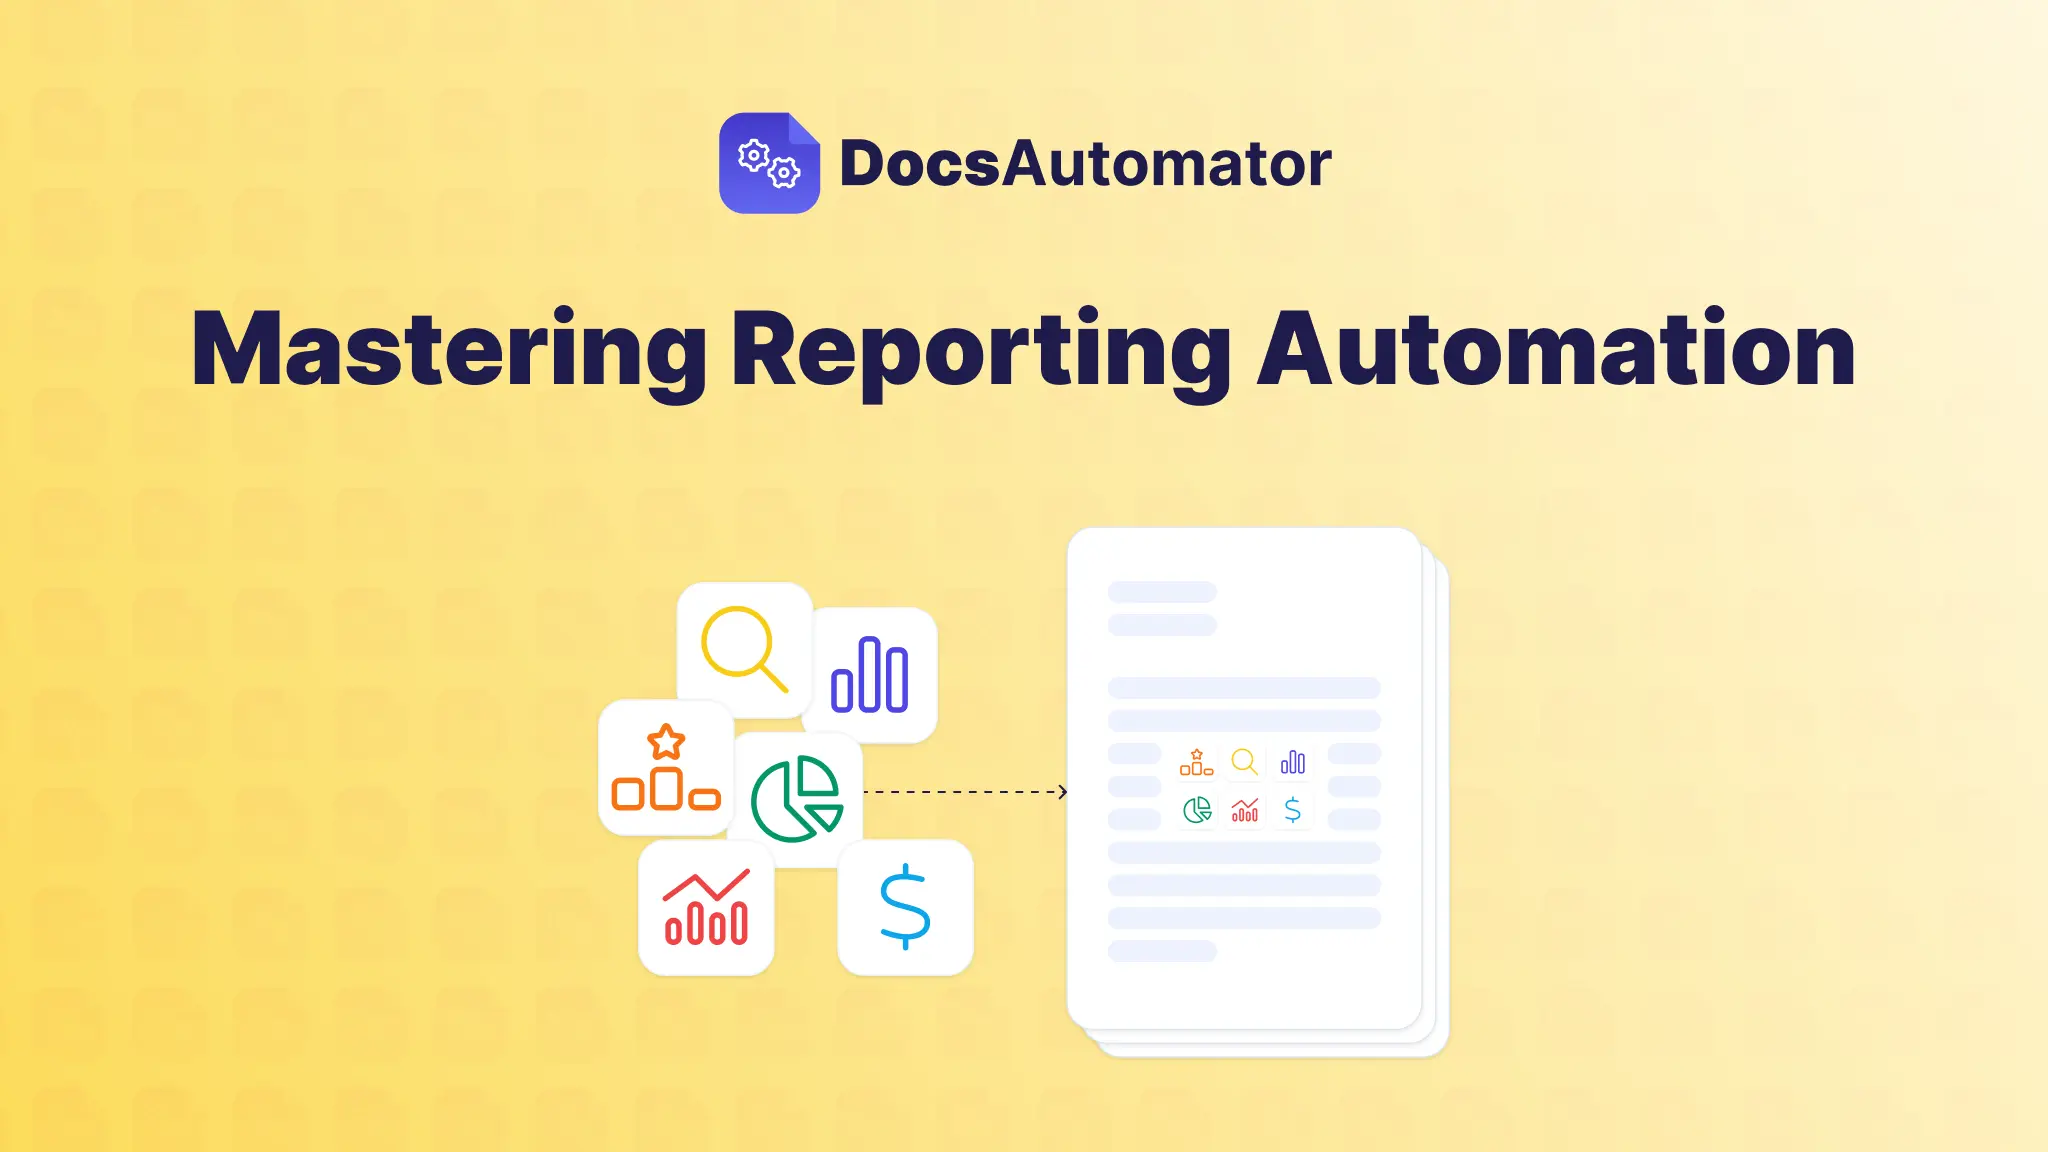
Mastering Reporting Automation
Discover how reporting automation saves time, eliminates errors, and provides real-time insights. Learn to build automated workflows with our practical guide.
Read full article
July 4, 2025
|
Tutorials
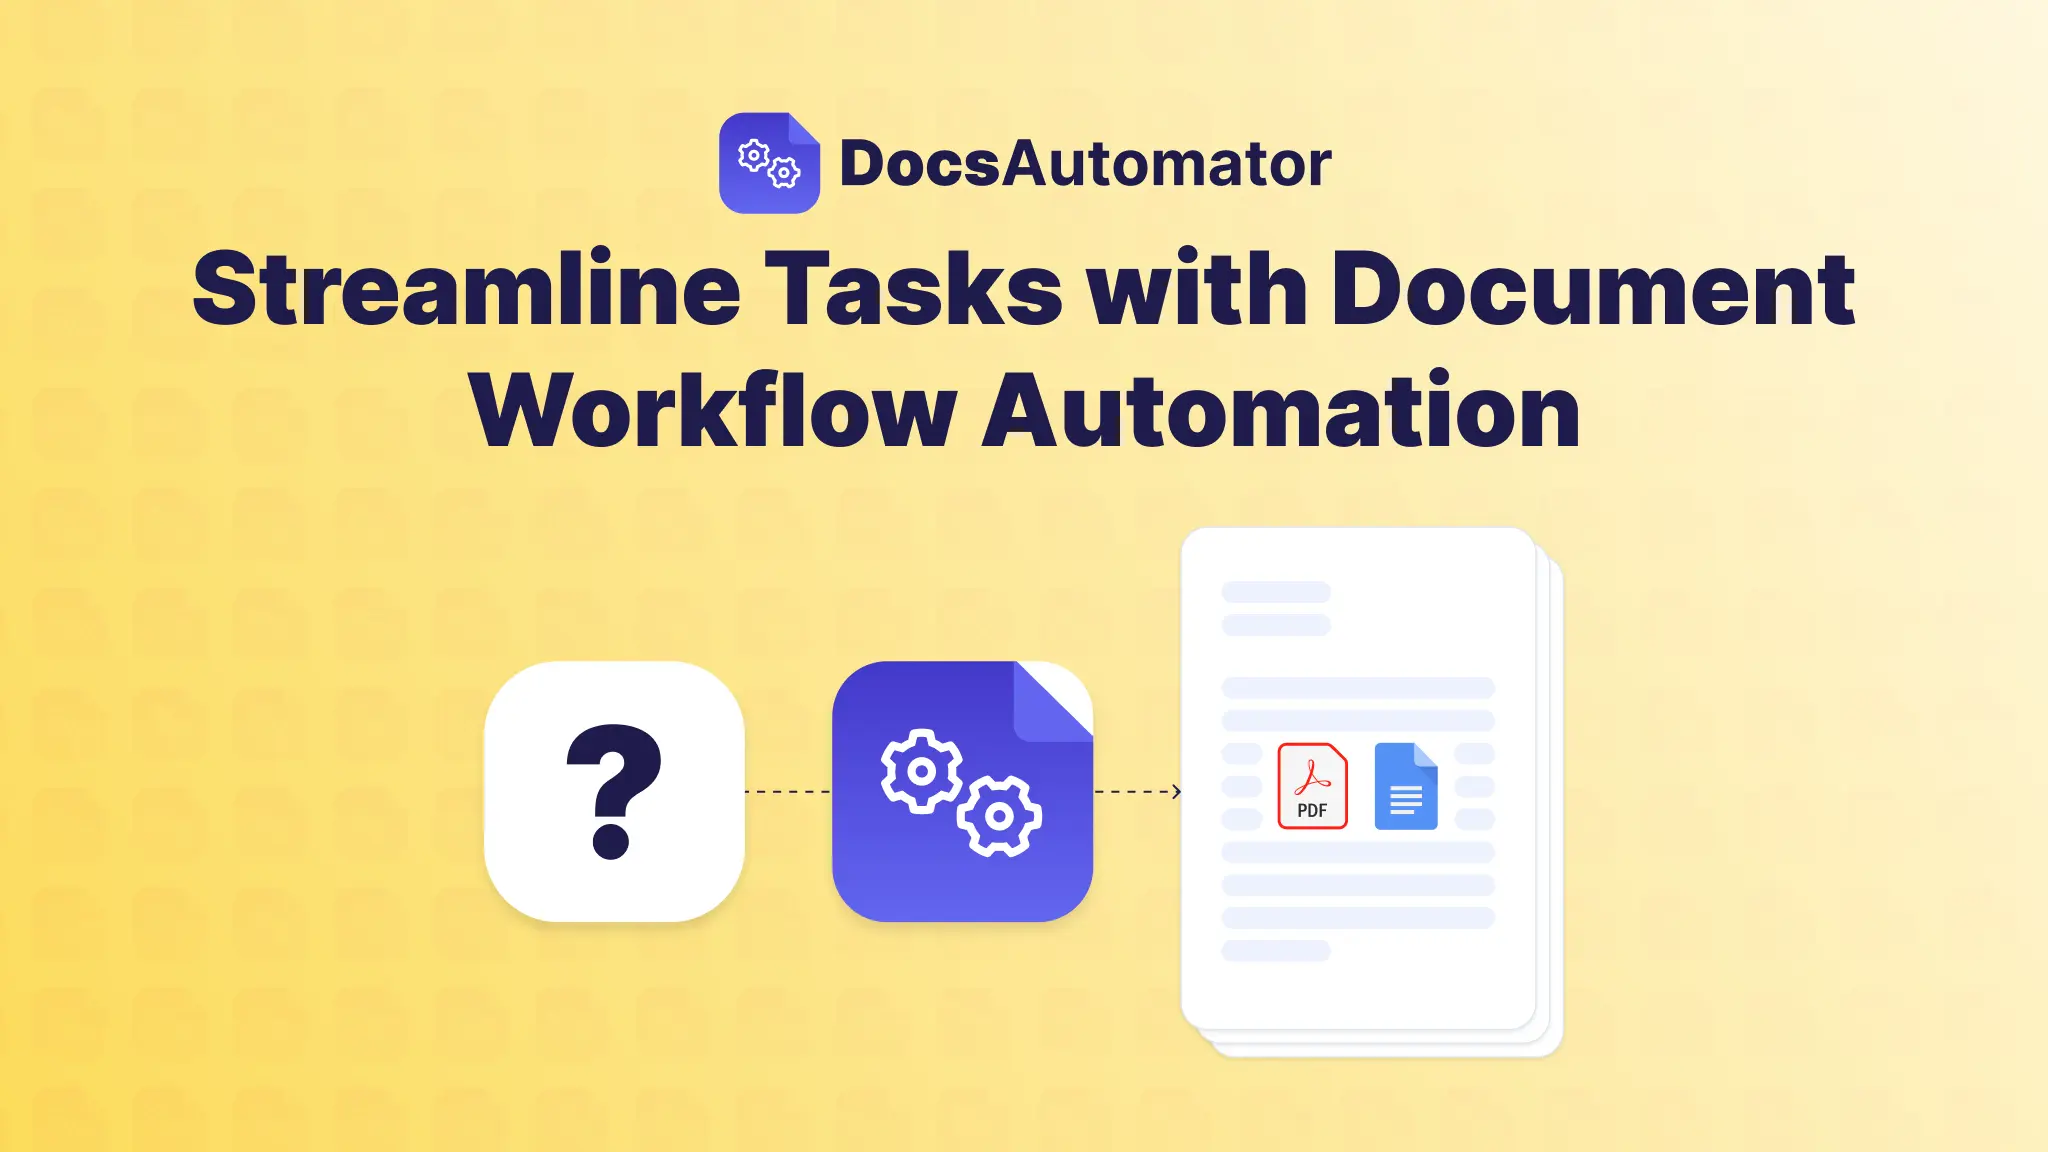
Streamline Tasks with Document Workflow Automation
Learn how document workflow automation can optimize your processes, save time, and improve productivity. Start building efficient systems today!
Read full article
July 3, 2025
|
Tutorials
Automate Document Generation: A Practical Guide
Learn how to automate document generation with this practical guide. Connect data from Airtable or Glide, build workflows, and eliminate manual paperwork.
Read full article
July 2, 2025
|
Tutorials
Document Automation Software to Boost Your Workflow
Discover how document automation software transforms workflows. Learn about key features, benefits, and how to choose the right tool for your business.
Read full article
November 6, 2024
|
News
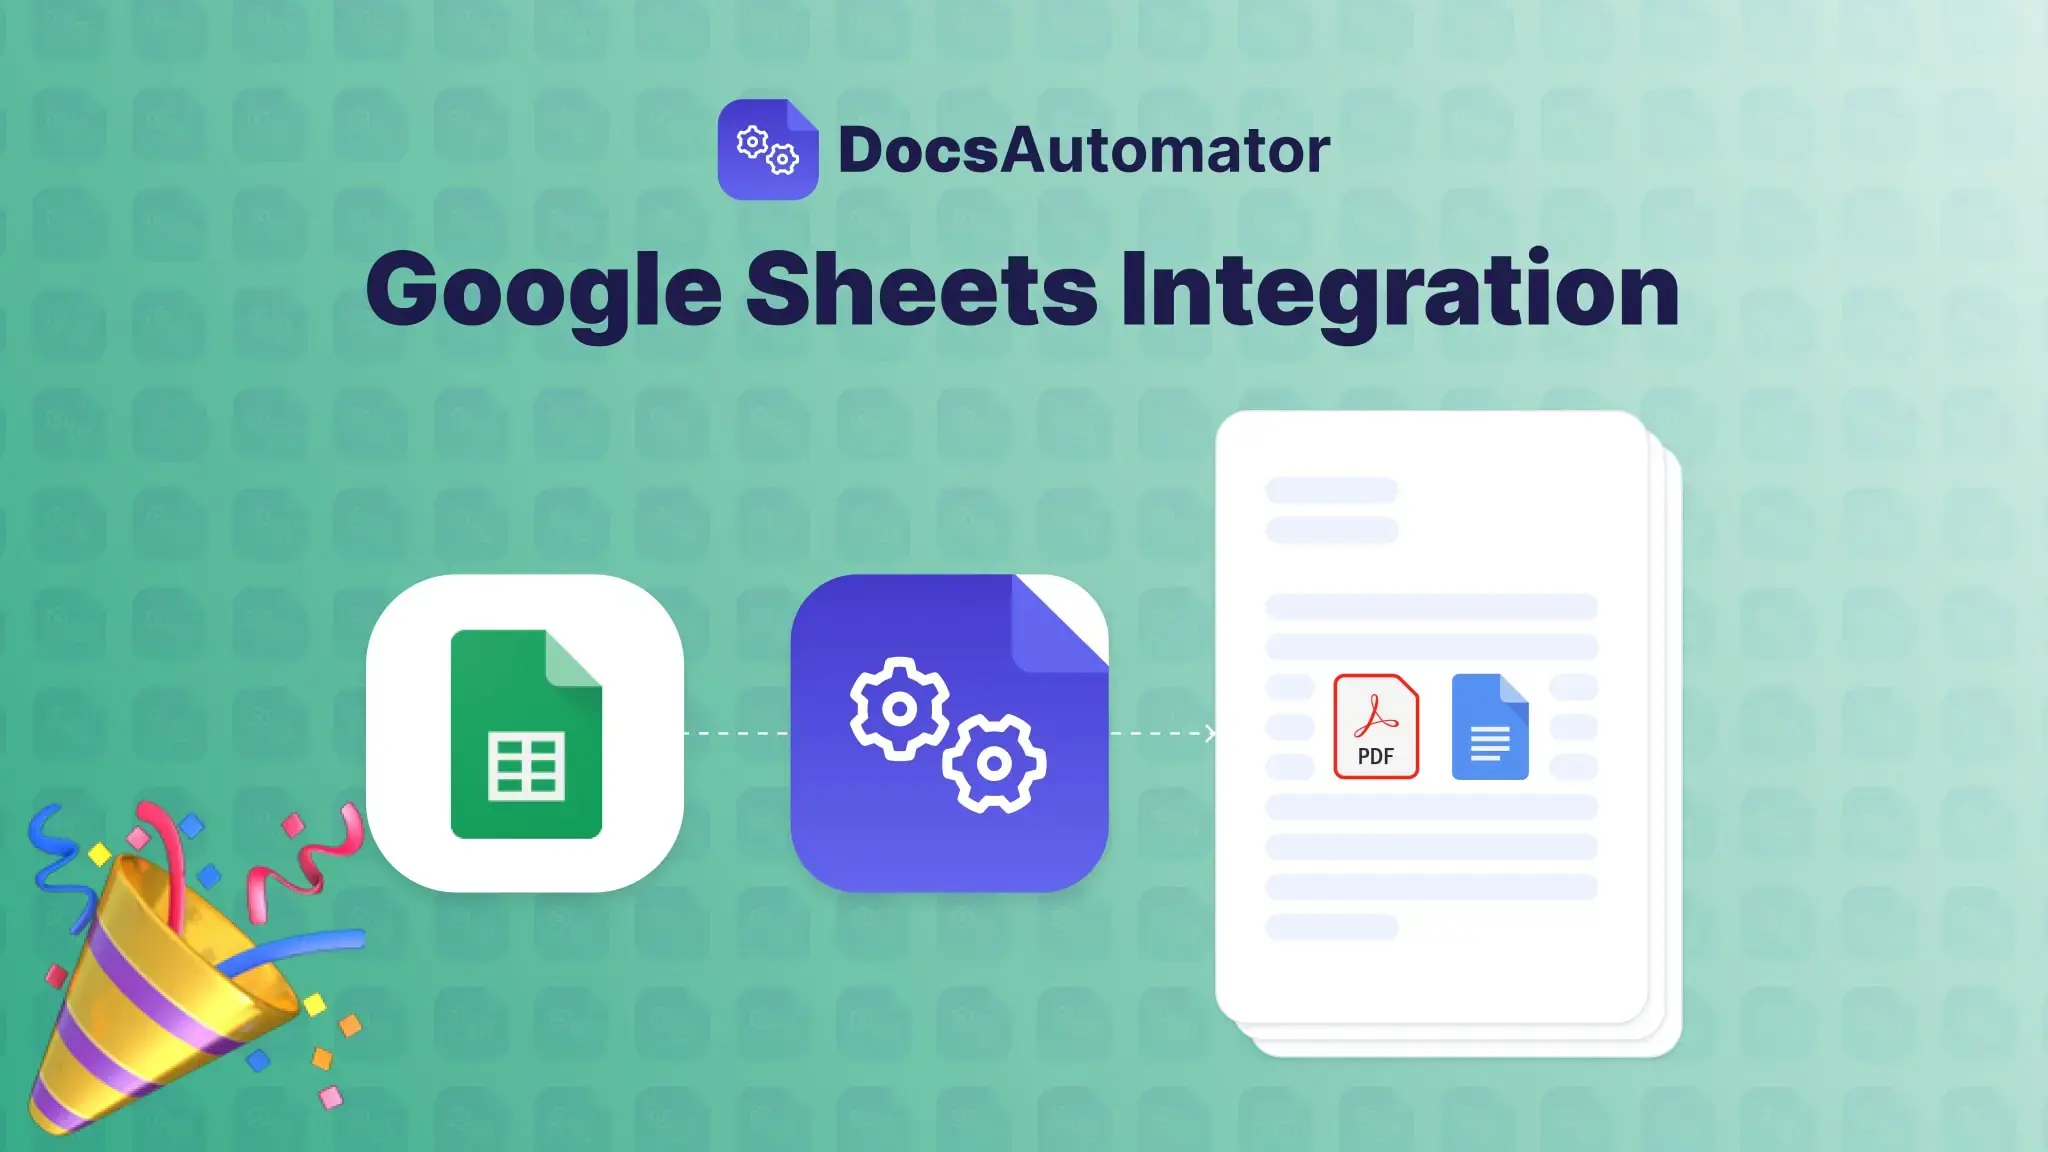
Announcing DocsAutomator’s Google Sheets Integration: Turn Spreadsheet Data into Professional PDFs in Minutes!
Instantly Turn Your Spreadsheet Data into Professional PDFs and Docs with the New Google Sheets Integration!
Read full article
September 10, 2024
|
Tutorials
15 Essential Document Automation Features For Businesses
Explore 15 features a document automation software must have to streamline business processes, improve productivity, and ensure compliance.
Read full article
September 5, 2024
|
Tutorials
What Is Document Automation? — Top Use Cases And Benefits
Discover how document automation revolutionizes business processes by transforming manual paperwork into streamlined, error-free workflows. Learn about the key benefits, ideal use cases, and implementation strategies for leveraging this powerful tech
Read full article
September 3, 2024
|
Tutorials
5 Essential Business Requirement Document Templates for Startups - Free Download
Simplify startup document creation tasks with 5 free dynamic document templates. Automate invoices, meeting notes, project reports, and more with DocsAutomator.
Read full article
September 3, 2024
|
Tutorials
How To Create Document Templates For Project Proposals - with Google Docs and Airtable
Learn how to create dynamic project proposals using Google Docs, Airtable, and DocsAutomator to streamline your project documentation processes.
Read full article
July 29, 2024
|
Tutorials
Automating Invoice Creation with Zapier and Google Docs
How to use Zapier and Google Docs for a straightforward system for automatically generating invoices.
Read full article
April 18, 2024
|
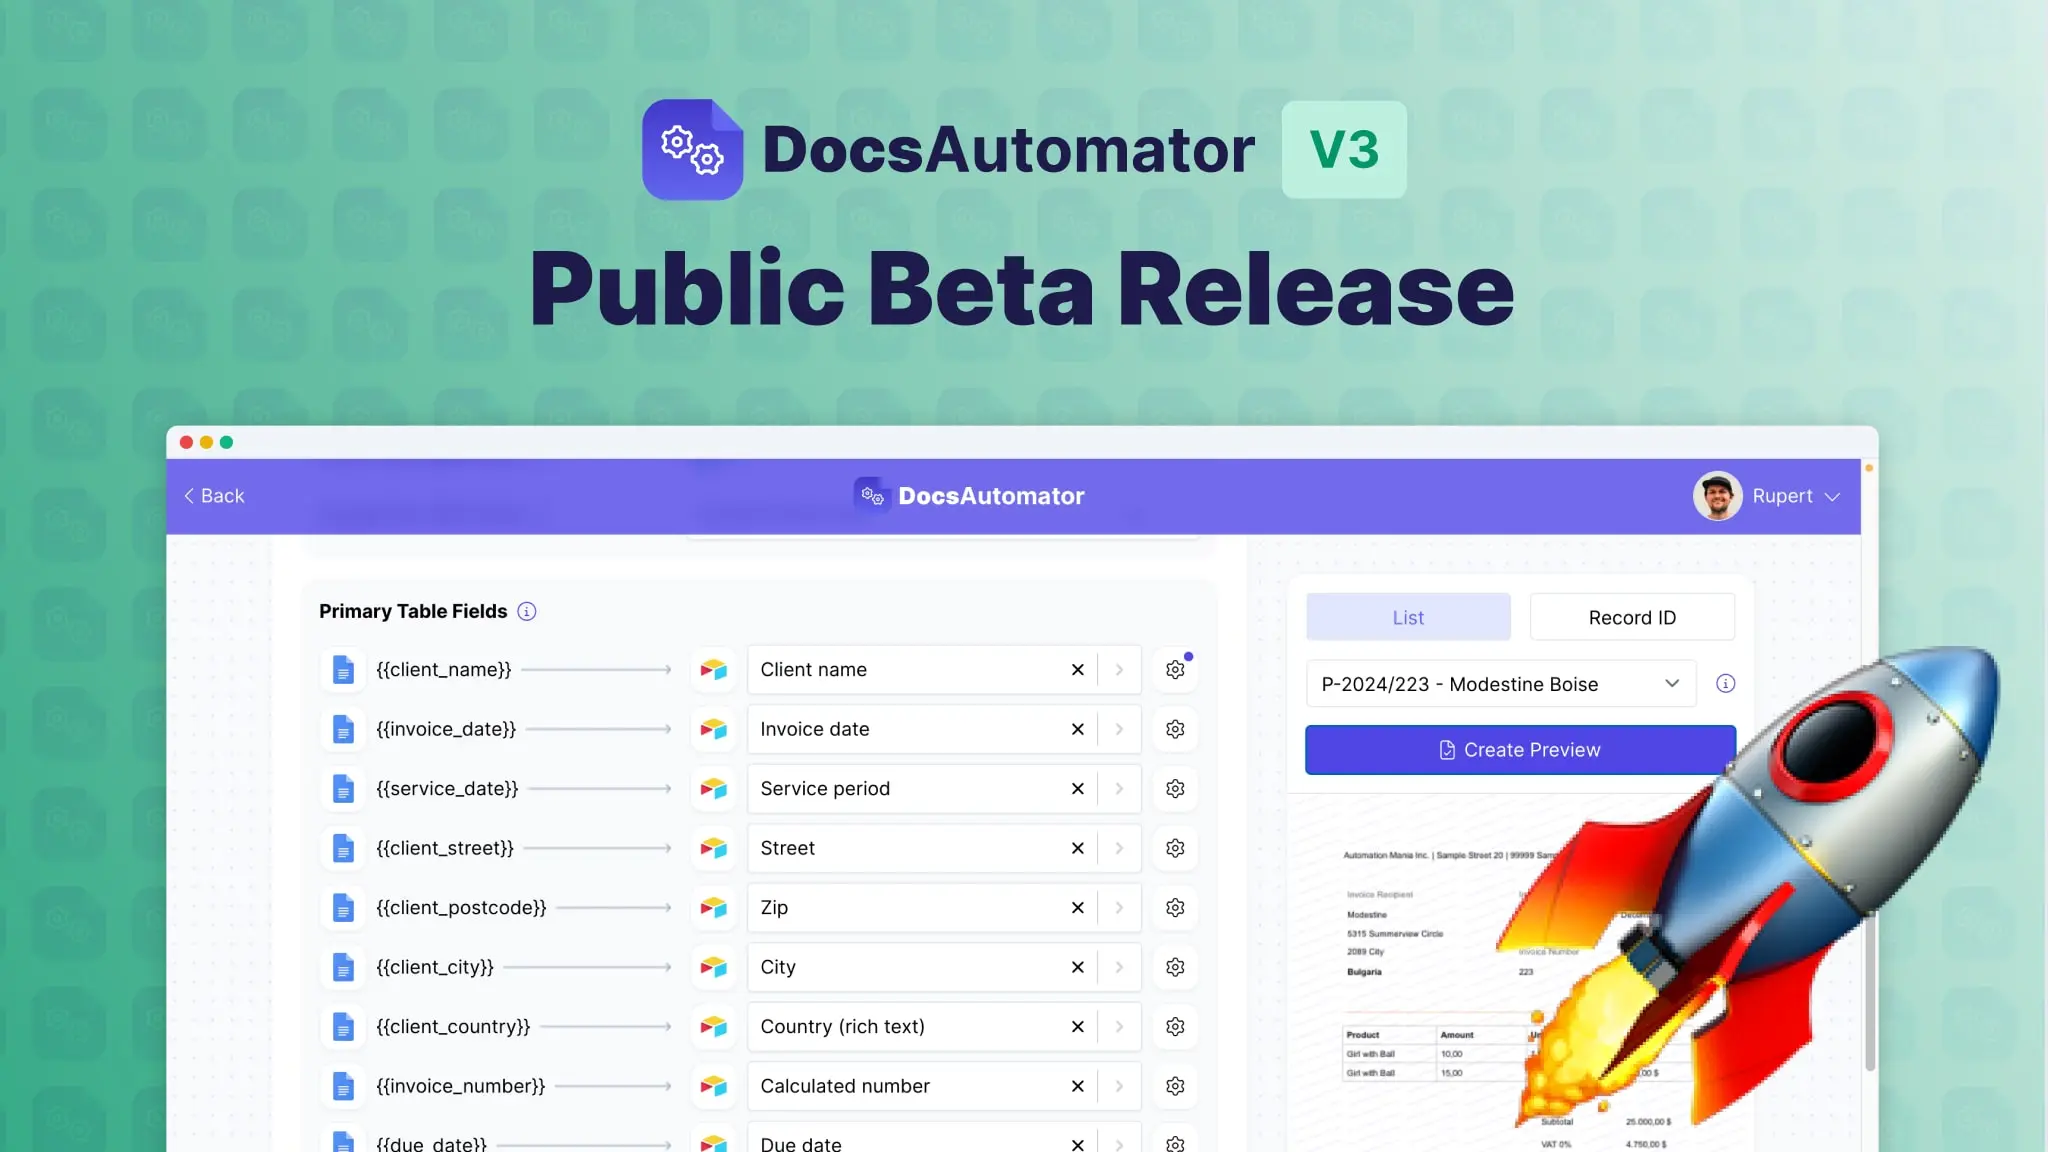
News
DocsAutomator v3 Public Beta Release
I'm super excited to release DocsAutomator's newest version — DocsAutomator v3! It's packed with a ton of new features that make document creation more flexible & powerful and I'm sure it's going to take your document workflows to the next level…
Read full article
February 1, 2024
|
News
DocsAutomator turns 1: 20 key learnings
One year ago today, February 1st 2023, I launched DocsAutomator after 4-5 weeks of 6am coding sessions. Exhausted and with low expectations, I pushed to production not knowing if anyone will even notice. It proofed to be the single best thing I've…
Read full article
Start automating & signing in minutes!
Unlimited testing, no credit card required. See
pricing
for details.
Test for free