Running a business by only watching your bank balance is like driving a car by only looking at the fuel gauge. You know how much gas is in the tank, but you have no idea about your speed, engine health, or if you're even on the right road. This single number fails to reveal crucial details about profitability, operational efficiency, and long-term financial stability. A clear view of your financial health is essential for making informed, strategic decisions.
This guide moves beyond theory and dives straight into practical application. We will break down the seven most critical financial reports every business needs, providing a simple financial report example for each one. You'll get actionable templates and clear explanations of what each line item means for your company's future.
Whether you manage your data in Airtable, Glide, a custom API, or a basic spreadsheet, these examples are designed for easy adaptation. You'll learn how to transform raw numbers into powerful insights, enabling you to identify opportunities, manage risks, and steer your business toward sustainable growth. Let’s get started.
1. Income Statement (Profit & Loss Statement)
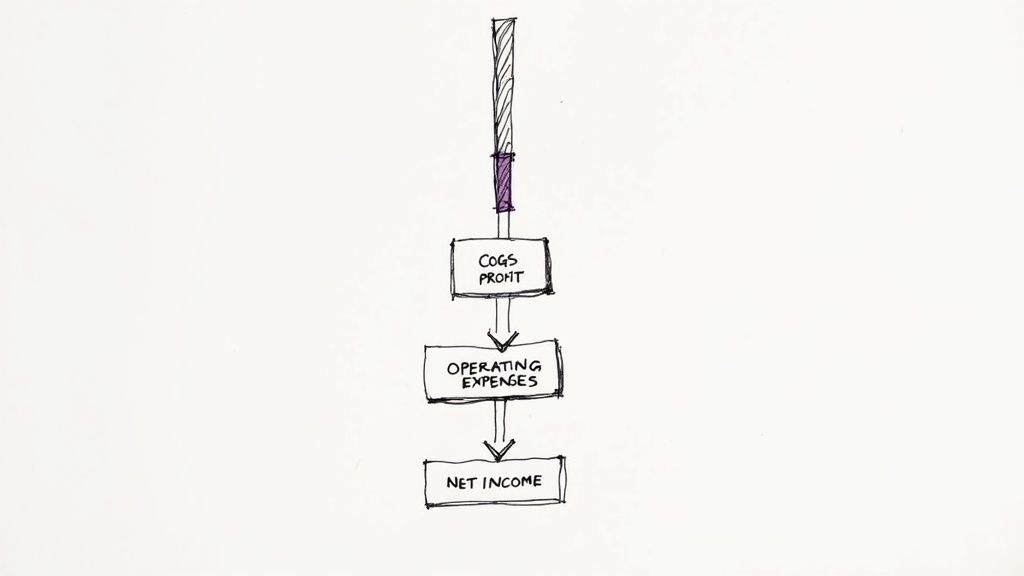
The Income Statement, often called a Profit and Loss (P&L) statement, is the most direct measure of your business's profitability over a set period. It subtracts your total costs and expenses from your total revenues to arrive at your net income or loss. This report is fundamental because it answers the most critical business question: "Are we making money?"
This simple financial report example is invaluable for strategic decision-making. Whether you're a freelancer tracking annual earnings or a retail store analyzing seasonal performance, the P&L provides a clear narrative of your financial health. It's a cornerstone of generally accepted accounting principles (GAAP) and a standard feature in software like QuickBooks.
Strategic Analysis & Insights
A P&L statement isn't just a list of numbers; it's a diagnostic tool. By analyzing its components, you can pinpoint strengths and weaknesses in your operations.
- Gross Margin Focus: The difference between your revenue and the Cost of Goods Sold (COGS) is your gross profit. A declining gross margin might signal rising material costs or inefficient production that needs immediate attention.
- Operating Expense Trends: Are your marketing, administrative, or salary expenses growing faster than your revenue? The P&L makes these trends visible, allowing you to control costs before they erode your profits.
- Revenue Stream Performance: If you have multiple products or services, a detailed P&L can break down the profitability of each one. This helps you decide where to invest more resources and what to potentially discontinue.
Actionable Takeaways
You can use a simple P&L to make immediate, data-driven decisions. For instance, an operations manager can connect their Airtable or ClickUp project data to a reporting tool like DocsAutomator to generate a P&L that compares budget vs. actuals for a specific project. A practical example would be an e-commerce business using Zapier to push sales data from Shopify and expense data from their accounting software into an Airtable base. This base then automatically generates a monthly P&L, providing a clear view of profitability without manual compilation.
Key Takeaway: Regularly review your P&L on a monthly basis. This frequency allows you to identify negative trends quickly, such as unexpected cost increases or revenue dips, and take corrective action before a small issue becomes a major problem.
Comparing your current P&L to previous periods (like last month or the same quarter last year) provides vital context on your business's growth trajectory. For a deeper dive into the nuances of presenting these figures effectively, explore these financial reporting best practices for more advanced strategies.
2. Balance Sheet
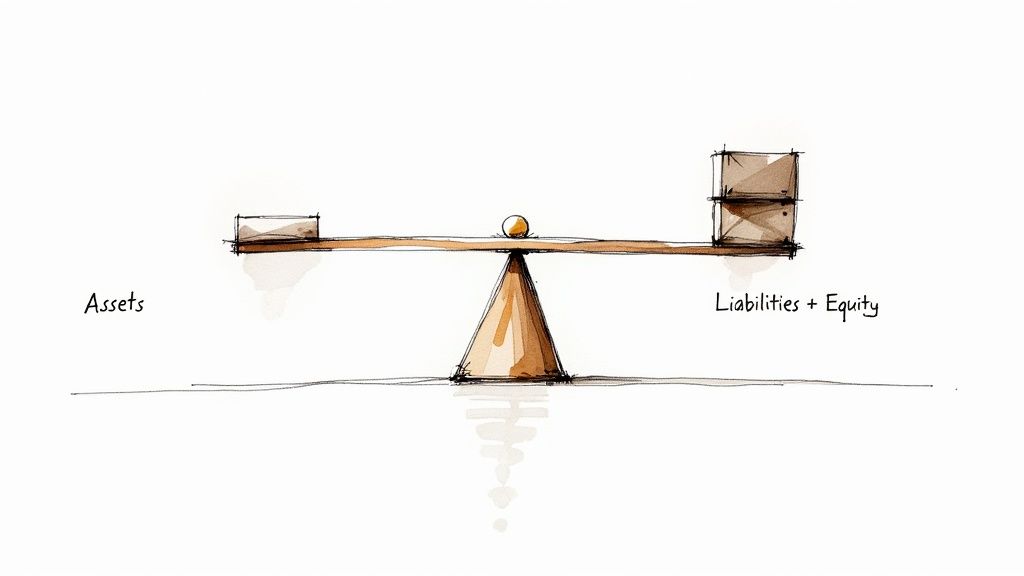
The Balance Sheet is a snapshot financial report that provides a clear picture of your company's financial position at a single point in time. It reveals what your company owns (assets), what it owes (liabilities), and the owner's stake (equity). This report is governed by the fundamental accounting equation: Assets = Liabilities + Equity, ensuring all accounts are reconciled and balanced.
This simple financial report example is crucial for understanding your business's solvency and financial structure. It's an essential document for securing a bank loan, performing a year-end review, or providing transparency in a publicly traded company's annual report. Stakeholders, from investors to lenders, rely on it to assess risk and financial stability.
Strategic Analysis & Insights
A Balance Sheet is more than a static list of accounts; it's a powerful tool for strategic financial management. Analyzing its components helps you gauge liquidity, leverage, and operational efficiency.
- Working Capital Assessment: By subtracting current liabilities from current assets, you determine your working capital. A positive and healthy working capital figure indicates you have sufficient short-term assets to cover your short-term debts, signaling good liquidity.
- Debt-to-Equity Ratio: This ratio (Total Liabilities / Shareholder Equity) shows how much of your company is financed through debt versus equity. A high ratio can indicate significant risk, while a low ratio might suggest a conservative financial approach.
- Asset Composition: Analyzing the breakdown between current assets (like cash and inventory) and long-term assets (like property and equipment) reveals your business's operational focus and capital investment strategy.
Actionable Takeaways
You can leverage the Balance Sheet to make critical, informed business decisions. For instance, a project manager using an Airtable base to track equipment purchases can use an automation tool to feed this data directly into a Balance Sheet template, ensuring an up-to-date view of company assets without manual data entry. As a practical example, a small manufacturing company using SmartSuite to manage its inventory and equipment logs can automatically update its "Assets" section. When a new machine is purchased, the entry in SmartSuite triggers an update to the Balance Sheet, providing real-time data for financial planning.
Key Takeaway: Prepare and analyze your Balance Sheet on at least a quarterly, if not monthly, basis. This allows you to monitor your working capital and debt levels closely, enabling you to proactively manage cash flow and make timely decisions about financing or investment before liquidity issues arise.
Comparing your current Balance Sheet to previous periods helps you track changes in your financial structure and assess the impact of your strategic decisions over time. For more guidance on creating robust and clear financial documents, consider exploring these best practices for financial reporting.
3. Cash Flow Statement
While an Income Statement shows profitability, a Cash Flow Statement reveals liquidity. It tracks the actual movement of cash into and out of your business, answering the vital question: "Do we have enough cash to operate?" This simple financial report example is critical because a profitable company on paper can still fail if it runs out of cash to pay its bills, employees, and suppliers.
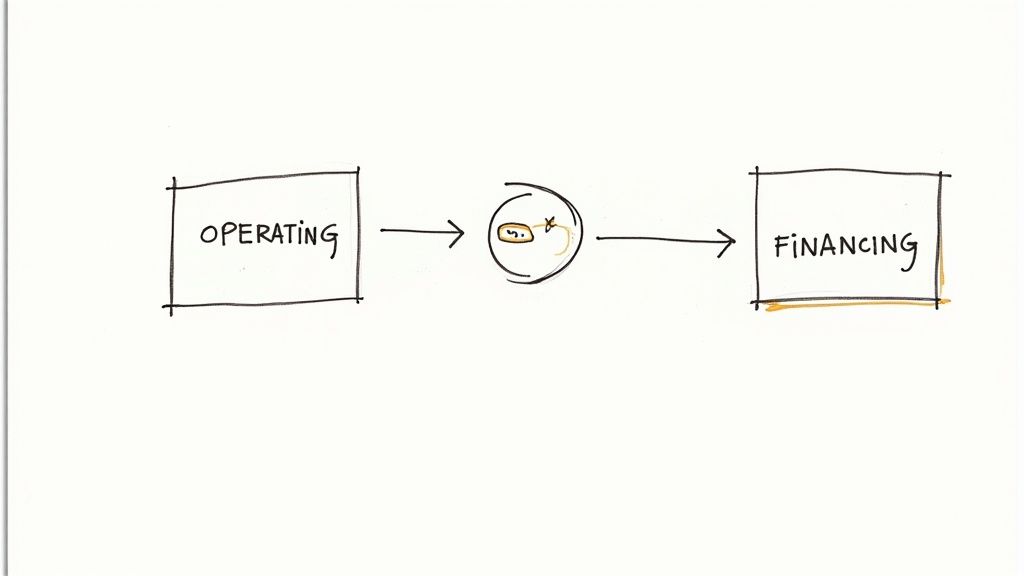
The statement is broken down into three core activities: operating, investing, and financing. This categorization helps you see exactly where your cash is coming from and where it's going. For a startup analyzing its runway or a seasonal business planning for the off-season, this report provides an indispensable, real-time view of its financial pulse, a cornerstone of venture capital due diligence and standard financial accounting.
Strategic Analysis & Insights
The Cash Flow Statement is a powerful tool for diagnosing your company's operational efficiency and financial stability. Analyzing its components helps you manage your most critical asset: cash.
- Operating Cash Flow (OCF): A positive and growing OCF indicates a healthy core business that generates enough cash to sustain and grow itself. A negative OCF is a major red flag, suggesting the company isn't generating sufficient cash from its main operations.
- Investing Activities: This section shows how you are allocating capital for long-term growth, such as buying equipment or property. Large cash outflows here can be a sign of expansion, while large inflows could mean you're selling off assets.
- Financing Activities: This reveals how you are funded, whether through taking on debt, repaying loans, or issuing equity. It provides a clear picture of your capital structure and obligations to lenders and investors.
Actionable Takeaways
You can leverage your Cash Flow Statement to make proactive financial decisions. For instance, a project manager can connect project payment schedules from a tool like Airtable to a reporting dashboard to forecast cash inflows and ensure they align with payroll and supplier payment dates. A practical example involves a consulting agency using Glide to create a simple app for its consultants to log billable hours. This data, once approved, automatically updates an Airtable base that feeds into a cash flow forecast, helping predict cash inflows from client payments more accurately.
Key Takeaway: Monitor your Cash Flow Statement weekly, especially if you have tight margins or seasonal sales cycles. This high frequency allows you to spot potential shortfalls early, manage accounts receivable more aggressively, and make informed decisions about large expenditures.
Understanding your Cash Flow Statement is crucial for implementing effective cash flow management techniques, ensuring the liquidity and sustainability of your operations. Comparing your projected cash flow to actuals helps refine your forecasting and budgeting for greater accuracy.
4. Budget vs. Actual Report
A Budget vs. Actual Report is a powerful comparative tool that places your planned financial figures directly alongside your actual results for a specific period. This report's primary function is to calculate the variance-the difference between what you planned to spend or earn and what actually happened. It’s an essential tool for accountability and control, answering the key question: "Are we on track with our financial goals?"
This simple financial report example is critical for proactive management. A marketing department can use it to track campaign spending against its budget, while a non-profit can measure program expenses against its grant allocations. It transforms your budget from a static planning document into a dynamic performance management tool, a core tenet of modern management accounting.
Strategic Analysis & Insights
Analyzing the variances in this report provides deep insights into your business's operational efficiency and financial discipline.
- Favorable vs. Unfavorable Variances: A favorable variance (e.g., lower-than-budgeted expenses or higher-than-budgeted revenue) isn't always good, and an unfavorable one isn't always bad. For example, lower marketing spend might save money but result in fewer leads. The key is to understand the why behind each number.
- Identify Problem Areas: This report immediately flags where you are overspending or underperforming. A restaurant seeing consistently high food cost variances can investigate potential waste, supplier price hikes, or theft.
- Performance Evaluation: It provides a clear, objective basis for evaluating the performance of departments, projects, or managers. It connects financial outcomes directly to operational activities.
Actionable Takeaways
You can leverage this report to enforce accountability and make agile adjustments. For instance, a project manager using a data source like Airtable can automate the generation of a weekly budget vs. actual report to see if a project is running over budget and take corrective action immediately. A practical example would be using ClickUp to manage a software development project. The budgeted hours (cost) for each task are set in ClickUp. As developers log their actual time, a simple automation can pull this data, compare it to the budget, and flag any tasks that are exceeding their cost allocation in real-time.
Key Takeaway: Focus on significant variances. Don't get bogged down investigating every minor difference. Set a threshold (e.g., any variance over 5% or $500) and prioritize your analysis on what matters most to keep your strategic plan on course.
Regularly reviewing this report helps foster a culture of financial responsibility within your team. To get started quickly, you can adapt a pre-built structure from these free Google Docs report templates to fit your business needs.
5. Break-Even Analysis Report
A Break-Even Analysis Report calculates the exact point where a business's total revenues equal its total costs. It reveals the minimum sales volume-in units or dollars-needed to cover all expenses without making a profit or a loss. This report is critical for pricing strategies, assessing the viability of a new product, and overall business planning. It answers the fundamental question: "How much do we need to sell just to stay afloat?"
This simple financial report example is an essential tool for startups and established businesses alike. Whether you're launching a new software feature or a restaurant owner evaluating a new menu item, the break-even analysis provides a clear target. It shifts your perspective from simply generating revenue to understanding the revenue required to achieve profitability.
Strategic Analysis & Insights
The Break-Even Analysis Report is more than a calculation; it's a strategic guide for sustainable growth. Analyzing its core components-fixed costs, variable costs, and price per unit-unlocks deep operational insights.
- Pricing Strategy Validation: The report directly shows how price changes impact your break-even point. A small price increase could dramatically lower the number of units you need to sell to be profitable, making it a powerful tool for testing pricing models before launch.
- Cost Structure Scrutiny: It forces you to categorize every expense as either fixed (rent, salaries) or variable (materials, commissions). This exercise often reveals opportunities to reduce fixed costs or negotiate better terms for variable costs, directly lowering your break-even threshold.
- Viability and Risk Assessment: Before investing heavily in a new venture or product, this analysis provides a clear go/no-go signal. If the required sales volume seems unattainable, you can re-evaluate the plan or scrap it, mitigating significant financial risk.
Actionable Takeaways
You can use a break-even analysis to set clear, motivating sales targets. For instance, a project manager using Airtable to track a new product launch can input fixed costs (marketing campaign, development hours) and variable costs (per-unit manufacturing) to automatically calculate the break-even point. This figure becomes the primary KPI for the sales and marketing teams. As a practical example, a startup can connect to a custom API from their manufacturing partner to pull real-time variable costs per unit. This data, combined with fixed costs tracked in a spreadsheet, automatically recalculates the break-even point as production costs fluctuate.
Key Takeaway: Perform a break-even analysis before any major financial commitment, such as a new product launch, entering a new market, or a significant price change. It acts as a crucial reality check against overly optimistic forecasts.
Regularly updating your analysis with current cost and pricing data keeps it relevant. Combining it with a sensitivity analysis, where you model different cost and price scenarios, prepares your business for market volatility and helps you build more resilient financial plans.
6. Key Performance Indicators (KPI) Dashboard
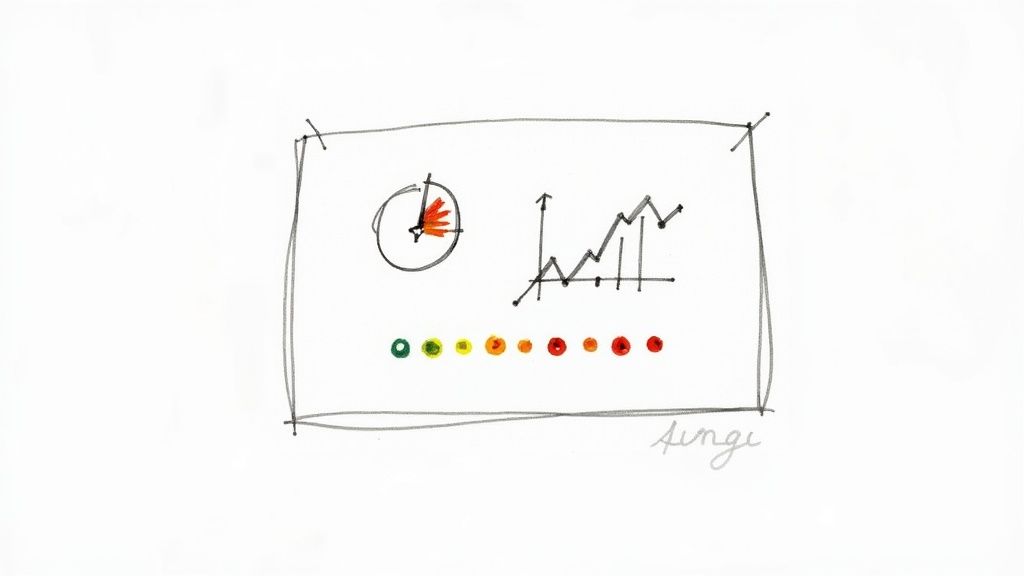
A Key Performance Indicators (KPI) Dashboard is a visual financial report that distills your most critical financial metrics into a single, easy-to-understand view. Instead of combing through dense statements, it provides a high-level snapshot of business performance, allowing for quick analysis and immediate insight. This report answers the vital question: "Are we hitting our most important targets?"
This simple financial report example is essential for modern businesses that need to track performance in real time. For an e-commerce store, it might display daily sales and conversion rates; for a SaaS company, it would focus on Monthly Recurring Revenue (MRR) and customer churn. By consolidating key data, a KPI dashboard helps align teams around specific, measurable goals.
Strategic Analysis & Insights
A KPI dashboard's power lies in its focus and clarity. By carefully selecting which metrics to display, you can direct your team's attention to what truly drives business success.
- Leading vs. Lagging Indicators: A well-designed dashboard includes both. Lagging indicators like Net Profit tell you about past performance. Leading indicators like Sales Pipeline Value or Website Traffic can help predict future revenue, allowing you to be proactive rather than reactive.
- Performance Against Targets: Dashboards excel at showing actual performance versus pre-set goals. Visual cues like red/green indicators or progress bars instantly signal whether you are on track, behind, or ahead of your targets for metrics like Customer Acquisition Cost (CAC) or Average Revenue Per User (ARPU).
- Operational Efficiency: Include KPIs that connect financial outcomes to operational activities. For a manufacturing business, tracking Unit Production Cost or Order Fulfillment Time on the dashboard can highlight operational bottlenecks that directly impact your bottom line.
Actionable Takeaways
You can use a KPI dashboard to foster a data-driven culture. For instance, a project manager using Airtable can set up a dashboard that pulls data on project budgets, timelines, and resource allocation, giving stakeholders a live view of project health without needing a formal meeting. A practical example for a Noloco customer portal would be to display client-specific KPIs, such as "Active Projects," "Total Invoiced," and "Outstanding Balance," pulling data directly from an underlying SmartSuite or Airtable database. This gives clients a real-time view of their account status and improves transparency.
Key Takeaway: Limit your dashboard to 5-7 truly essential KPIs to avoid information overload. The goal is clarity, not complexity. Review and adjust these metrics quarterly to ensure they remain aligned with your evolving business strategy and objectives.
A dynamic dashboard is far more powerful than a static report. For those looking to move beyond manual updates, you can explore how reporting automation can keep your KPIs continuously refreshed, providing your team with the most current data for decision-making.
7. Accounts Receivable Aging Report
The Accounts Receivable (A/R) Aging Report is a critical tool for managing your company's cash flow. It categorizes your outstanding customer invoices based on the length of time they have been unpaid, typically in columns like 0-30 days, 31-60 days, 61-90 days, and 90+ days. This report directly answers the question: "Who owes us money, and how long have they owed it?"
This simple financial report example is essential for any business that extends credit to customers, such as B2B service companies with net-30 payment terms or manufacturing firms selling to distributors. It provides a clear, at-a-glance view of the health of your receivables and highlights potential collection issues before they escalate into significant cash flow problems. It's a standard report in nearly all accounting software and a cornerstone of effective credit management.
Strategic Analysis & Insights
An A/R aging report is more than just a list of overdue invoices; it's a predictive indicator of your company's financial stability. Analyzing it reveals patterns in customer payments and the effectiveness of your credit policies.
- Identify Problem Accounts: The report immediately flags which customers are consistently paying late. A large balance in the 60+ day columns is a major red flag, indicating a high risk of that debt becoming uncollectible.
- Evaluate Credit Policies: If a significant percentage of your total receivables is consistently in the older buckets, it might suggest your credit terms are too lenient or your initial vetting process for new customers is inadequate.
- Forecast Cash Flow: By understanding the average collection period for your invoices, you can more accurately forecast your cash inflows. This is vital for planning major expenses, investments, or payroll.
Actionable Takeaways
You can leverage an A/R aging report to take proactive steps to improve collections. For instance, a finance manager can connect their accounting system to a tool like Airtable to build a dashboard that automatically flags accounts as they move into the "31-60 day" bracket, triggering an automated follow-up email sequence. A practical example would be using Zapier to watch for new "overdue" invoices in QuickBooks Online. This trigger could then create a task in ClickUp for the account manager to personally call the client, ensuring no overdue invoice is missed.
Key Takeaway: Generate and review your A/R aging report on a weekly basis, especially during periods of tight cash flow. Immediately initiate collection procedures for any invoice that surpasses 30 days past due, as the probability of collection decreases significantly with each passing week.
Setting clear, tiered collection procedures (e.g., friendly reminder at 30 days, firm call at 45 days, final notice at 60 days) is a direct, actionable strategy derived from this report. Offering a small discount for early payment can also be an effective tactic to improve the numbers in your "Current" column and bolster your immediate cash position.
7 Financial Report Examples Comparison
From Reports to Results: Turning Insights into Action
Throughout this guide, we have demystified some of the most critical financial documents by exploring a simple financial report example for each key area of your business. From the Income Statement revealing your profitability to the Accounts Receivable Aging Report highlighting potential cash flow issues, each report serves a distinct, vital purpose. These are not merely historical records; they are your strategic tools for navigating the future.
The true power of these reports is unlocked when you move from simply generating them to actively interpreting and acting upon the data within. The examples we’ve analyzed, including the Profit & Loss Statement, Cash Flow Statement, and Balance Sheet, form the foundational trio of financial health. Layering in operational reports like the Budget vs. Actual and the KPI Dashboard transforms this data into a comprehensive performance management system.
Your Path from Data to Decisions
Mastering these reports is an iterative process. The journey begins with consistent and accurate data entry, progresses to regular report generation, and culminates in strategic action.
- Establish a Rhythm: Create a fixed schedule for reviewing your reports. Operational reports like the A/R Aging might need weekly attention, while strategic reports like the Income Statement and Balance Sheet are typically reviewed monthly.
- Identify Key Drivers: For each report, pinpoint the 2-3 most important metrics. On your P&L, this might be Gross Profit Margin and Net Profit. For your Cash Flow Statement, it could be Operating Cash Flow. Focusing on these drivers prevents data overload.
- Ask Strategic Questions: Use the reports to challenge your assumptions. Why did our material costs increase this month? Is our sales growth translating into actual cash in the bank? Why is our break-even point higher than last quarter? These questions are the catalysts for meaningful change.
Strategic Insight: A consistent and well-documented financial history is non-negotiable for long-term strategic planning. Ultimately, the precision and clarity of your financial reports are paramount when it comes to strategically understanding how to value a business for a successful sale, ensuring you achieve optimal outcomes.
Bridging the Gap with Automation
For many SMEs and teams, the biggest hurdle is the manual effort required to compile these reports. This is where modern tools and automation come into play. Connecting your data sources, whether they are in Airtable, Glide, Zapier, or a custom API, to a document automation platform allows you to generate these crucial reports on a schedule, freeing up your team to focus on analysis rather than assembly.
By embracing the discipline of financial reporting, you are not just "doing accounting." You are building a resilient, adaptable, and more valuable business. Each simple financial report example we’ve shared is a template for clarity and a stepping stone toward greater control and predictable success.
Tired of manually creating financial reports from your Airtable, Glide, or Zapier data? DocsAutomator can help you generate beautiful, customized PDFs and Google Docs on autopilot, so you can focus on insights, not paperwork. Streamline your reporting today with DocsAutomator.